In the first part of this article about the data architecture of business plans https://waynekurtz.wordpress.com/2013/09/28/the-data-architecture-of-business-plans-part-1-an-overview/, we discussed an industry standard meta-model for modeling business motivation[i]. We started with the four core elements of business plans: End, Means, Influencer, and Assessment. We identified Desired Result as the type of End that an enterprise intends to maintain, and Goal and Objective as two types of Desired Result. We also included Measurement as an expression of an Objective. On the Means side we identified Course of Action which represents the approach or plan for configuring some aspect of the enterprise, Strategy as the essential Course of Action for carrying out the enterprise’s plan, and Tactic as the means to implement the Strategy.
An Assessment, we’ve seen, is a judgment about the impact of Influencers on the enterprise’s Desired Results and Courses of Action[ii]. Assessment Elements are the components of an Assessment that link it to individual Desired Results and Courses of Action. The net effect of an Assessment Element is the identification of a measured Potential Impact[iii].
A Key Performance Indicator (KPI) is a type of Assessment that is a judgment about the impact of the difference between two measurements, the Target Expression, associated with a Desired Result and the Result Expression, associated with a Course of Action.
Desired Results
Figure 10 illustrates the relationship between a Desired Result and a Key Performance Indicator. A Key Performance Indicator has exactly one Target Expression which is based on one and only one Objective which quantifies one and only one Goal. As we’ve already observed, both Goal and Objective are types of Desired Result. If the Desired Result is a Goal it may be quantified by one or more Objectives. Each Objective may be the basis of one or more Target Expressions. Each Target Expression is a part of one and only one KPI.
Figure 10. Desired Results and Target Expressions.

However, not all Goals are stated in a way that makes them easily quantifiable by an Objective. When a Goal cannot be quantified by a set of Objectives one of two things is bound to happen. Either the Goal becomes more or less irrelevant to the operation, productivity or culture of the enterprise and thus its significance is eventually deprecated, or Objectives that quantify it are eventually defined, vetted and socialized. There is a thin line between Goals and Objectives, as we’ve seen they are really just two types of the same thing, Desired Results. The difference between them is driven by the fact that we need a way to differentiate between Desired Results that can be measured and those that cannot. For purposes of performance management we ignore those that cannot be measured.
Courses of Action and Result Expressions
Figure 11 illustrates the relationship between a Course of Action and a Key Performance Indicator. A Key Performance Indicator has exactly one Result Expression which is based on one and only one Actual Result which is produced by one and only one Business Process which may employ one or more Efforts. Each Effort is invoked by one and only one Course of Action. However, a Course of Action may be invoked via one or more Efforts, each of which is used by one and only one Business Process. Each Business Process may produce one or more Actual Results, each which may be the basis of one or more Result Expressions. A Result Expression is a part of one and only one KPI.
Figure 11. Courses of Action and Result Expressions.

It is assumed that the Potential Impact of a KPI can be judged, usually in discrete intervals, along a continuum from very positive or very negative. What constitutes positive or negative for any KPI is determined by the requirements of the business and is subject to change over time. This fact is why configuration management of KPIs is important. Without configuration management, the ability to compare not just KPI status and trend values from period to period, but the evolution of the method by which they were calculated can be tracked. This becomes more important as organizations begin to not only use KPIs to do assessments and influence behavior, but also to judge the effectiveness of the KPIs themselves, their relevance to changing business patterns and their effectiveness in bringing attention to areas that need it. In this article however we are primarily interested in the design and construction of KPIs and not as much in how they potentially impact and are impacted by various influencers.
The Role of Effort
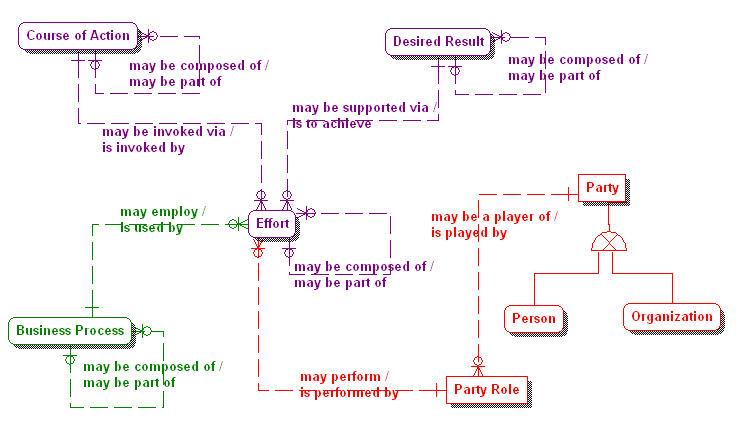
Figure 12 illustrates the central role that Effort plays in the meta-model of the data architecture of business plans. A Course of Action, as we saw in Figure 11, may be invoked via one or more Efforts. The figure also shows that a Desired Result may be supported via one or more Efforts. It shows that a Business Process may employ one or more Efforts. Finally, a Party, which is either a Person or an Organization, may be a player of one or more Party Roles, one of which then may perform one or more Efforts.
From the perspective of an Effort it is invoked by one and only one Course of Action, in order to achieve one and only one Desired Result. It is also used by one and only one Business Process while it is performed by one and only one Party Role.
Figure 12. The central role of Effort in the business plans meta-model.
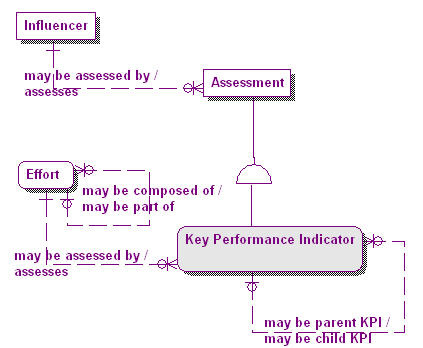
As stated earlier an Influencer is anything that can produce an effect on the enterprise without apparent exertion of tangible force or direct exercise of command[iv]. As depicted in Figure 13 we see that an Effort may be assessed by one or more Key Performance Indicators in the same way that an Influencer may be assessed by one or more Assessments. Correspondingly, a KPI assesses one and only one Effort, as an Assessment of which it is a subtype, assesses one and only one Influencer.
Figure 13. Key Performance Indicators and Influencers.
Key Performance Indicators
There are many different perspectives from which an organization’s performance can be viewed. There are also many different aspects in which each perspective on performance can be viewed. One aspect is that of motivation, or “why” has the performance turned out as it has and how can the organization improve its performance. At each perspective of the Motivation aspect[v] “why” type questions need to be answered. Answers to these questions are aided greatly by the assessments of the measurements that indicate the performance of the organization. These indicators are called performance indicators, and most organizations have a large number of them. Many of these are recorded because they “always have been” and others simply because they are relatively easy to produce. In order to provide decision makers with just the right set of performance indicators at the right time, the concept of the Key Performance Indicator (KPI) was developed. A KPI is not only an indicator of some aspect of performance but it is critical to improving that aspect of performance. It is also “key” because it can be clearly associated with a perspective of the enterprise. For example, there are KPIs that assess performance at the Planner perspective, at the Owner perspective, at the Designer or Architect perspective, at the Builder perspective, at the Subcontractor perspective, and even at the Functioning Enterprise perspective[vi]. The higher the perspective is in the enterprise architecture, the more strategic its assessments tend to be.
There are many business performance oriented books and articles that describe techniques for determining which performance indicators are Key Performance Indicators, and a study of how to select the best KPIs is beyond the scope of this article. Suffice it to say that the process is very specific to both the organization and its industry. There can be almost an unlimited number of performance indicators in any good sized enterprise. Not all performance indicators are of equal importance when it comes to assessing the performance of an enterprise. A performance indicator is said to be “key”, and thus a Key Performance Indicator when it can be demonstrated through measurements, that it is an indicator of the enterprise’s ability to accomplish its goals and objectives through the carrying out of its mission by strategic, tactical and operational means.
In this article we are interested in the data architecture of KPIs. Figure 14 illustrates the structure of a Key Performance Indicator. Since KPIs are Assessments of Effort and an Effort may be composed of other Efforts, a Key Performance Indicator may also be composed of other Key Performance Indicators.
Figure 14. The Key Performance Indicator meta-model.

In the meta-model of the business plans data architecture a Key Performance Indicator always has one each of three (3) expression elements. These are:
- Target Expression (aka Target) which is part of one and only one KPI and is based on one and only one Objective. An Objective may be the basis of more than one Target Expressions however, and thus may be used in more than one KPI.
- Result Expression (aka Result) which is part of one and only one KPI and is based on one and only one Actual Result. An Actual Result may be the basis of more than one Result Expressions however, and thus may be used in more than one KPI.
- Status Expression (aka Score) which is part of one and only one KPI and is used to indicate how the Result Expression compares to the Target Expression. It uses one Result Expression and one Target Expression. Each of which is used in exactly one Status Expression. It can take the following forms:
- A Score expressed as a percentage where the Result Expression is divided by the Target Expression, or
- A Function that returns a normalized value between -1 and 1 where 1 is interpreted as “Result is very good” and -1 is interpreted as “Result is very bad”
The Status Expression is often expressed graphically as an indicator using a set of color-coded graphic icons. For example: red, yellow or green icons to represent the different judgments made by the KPI. The specific indicator associated with the different states of the Status Expression is determined according to some Scoring Pattern and Banding Method combination, as we shall see shortly.
Figure 14 also shows the other four (4) optional elements of a KPI. These include:
- Trend Expression (Trend) which shows the directional change in the Status Expression. It can either show the change period over period, or be derived by a formula that returns a normalized value between -1 and 1 where 1 is interpreted as “Status is getting a lot better” and -1 is interpreted as “Status is getting a lot worse”.
- Weight Expression (Weight) which returns the relative weight of the KPI. If a KPI has a parent KPI you can define the weight to control the contribution of a KPI to its parent. For example, if there are two child KPIs, one weighted at 60% and the other at 40%, the parent KPI would be more influenced by the former than the latter.
- Time Expression which returns the current time dimension member that is relevant for the KPI. For example, time can be expressed either as a Point in Time indicating the KPI assesses the performance of an Event, or a duration, the difference between two points in time, to indicate performance assessment over a period of time.
- Responsible Party who is typically the person or organization responsible for the KPI. This responsibility can be for maintenance such as changing and updating any of the expression elements of the KPI. The responsibility can also be accountability for the performance of the enterprise underlying the KPI. These two responsibilities may or may not belong to the same Party. If it is the same party then issues of conflict of interest may arise. Over time, maintenance of KPIs and the Measurements on which they are based is very important. If KPIs are expected to continue to be relevant and return value to the enterprise they must be adjusted to reflect changing business conditions.
KPI Scoring and Banding
Probably the most common scoring and banding combination for Key Performance Indicators is illustrated by the example in Figures 15 and 16[vii]. This technique is referred to as “Increasing is Better – Actual Values”. In this method the higher the Score the better, with the Score determined by dividing the actual Result value by the actual Target value and expressing it as a percentage. Quite often a maximum Score value is set. Figure 15 illustrates this technique with five (5) component measurements rolled up into one composite measurement. The composite Score (119.95%) is simply the sum of the component Scores divided by the number of component KPIs (listed under “Measure” in the example below).
Figure 15. An example of an “Increasing is Better – Actual Values” type composite KPI.

As illustrated in Figure 16, threshold values are determined for the scoring bands of the KPI (three in this case) labeled “Good”, “Average” and “Poor”. If the Score is equal to or greater than 100%, it is assessed as “Good” and the Status indicator is a green square, if the Score is less than 100% but equal to or greater than 90% it is assessed as “Average” and the Status indicator is a yellow triangle, and finally if the Score is less than 90% it is assessed as “Poor” and the Status indicator is a red circle. KPIs for which there is no score are shown as white circles.
Trend is calculated by taking the difference between the current period Score and some previous period Score (in this case the previous month). If the difference is positive, an upward pointing “arrow in a circle” icon is displayed, if the difference is negative the arrow points downward, and if there is no change the circle icon has no arrow. Each KPI has a name, in this case “Administration” and a description (not shown). They are grouped into both Program and Strategic Scorecards which can then be incorporated into operational, tactical and strategic dashboards.
Figure 16. An example of a Scorecard with KPI scoring bands.

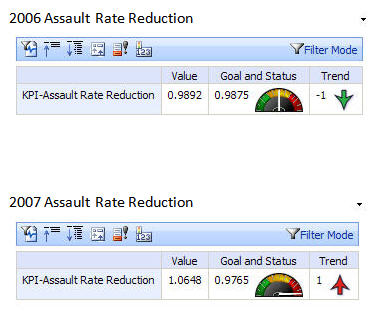
For performance assessment problems requiring more complex calculations, expressions are used instead of raw values when comparing the Result value to the Target value. This is a technique available in many BI and enterprise performance management (EPM) tools today. Rather than using the raw Target and Result values to calculate a Score, the results of a Target Expression and a Result Expression are factors in the calculation of a Status Expression. The two KPIs in Figure 17, though more simple in appearance, are intuitive in design and actually represent more complex calculations than the previous example.
The challenge here is to assess the performance of an institution in reducing criminal assaults cumulatively over a number of years. The top KPI represents performance for 2006 and the bottom for 2007. The Desired Result is stated in terms of the number of assaults per population of 1,000, the strategic Goal is to reduce assaults by 5% over a four year period, so the tactical Objective is to decrease the percentage by 1.25% each year. A Target Expression is used to calculate the Target value (labeled as “Goal”) applying each year’s percentage reduction to the previous year’s Target value thus producing a progressively aggressive Target.
The Actual Result produced by the Business Process is calculated by a Result Expression and expressed as a Result value (labeled “Value”). For 2006 the Result is 0.9892 and the Target is 0.9875, which is 1.25% less than the Target for 2005. This performance is assessed as “Average” by the Status Expression and banded with a yellow Status indicator (the middle yellow segment of the dial icon). The Trend is downward, i.e. there were fewer assaults in 2006 than in 2005, and thus the Trend indicator (the arrow) is pointed downward, and this is better than the previous period (2005) so the Trend indicator arrow is green. This is an example of a “Decreasing is Better – Actual Values” type of KPI.
In 2007 the Target is decreased to 0.9765 per 1,000 population, making the criteria for the “Good” and “Average” performance bands more stringent to meet. In the bottom KPI we see that the Actual value is 1.0648 thus pushing the Status indicator into the “Poor” band (the right-hand red segment of the dial icon) and causing the Trend indicator to point upward, because of the increase in Actual value and turn red because of the increase in percentage, calculated by the Result Expression, over the 2006 percentage.
Figure 17. An example of a “Decreasing is Better – Actual Values” type of complex KPI.
The Trend icon is an example of the use of one graphic icon to display two measurements. The direction of the arrow indicates the direction of the Trend, up or down, and the color indicates the judgment of that direction expressed, green for “Good” and red for “Poor”. This can be confusing if not explained. Also the use of color alone to indicate a state of performance means that about 10% of the adult population cannot discern its meaning because of color blindness. The example above is used to illustrate a concept not necessarily to indicate best KPI display practices.
Scoring Patterns and Banding Methods
The Scoring Pattern of a KPI (as seen above) indicates whether it is better to have a Result that is increasing, decreasing, or as close to the Target as possible, without being either higher or lower. The table below describes the three KPI Scoring Patterns.
|
Scoring Pattern |
Assessment Criteria |
| Increasing is Better | In general, the greater the value of the Result the better. Usually if the Result is greater than the Target it is considered to be a positive condition. For example, under most circumstances it is considered better to have increasing revenue. KPIs assessing revenue topics are generally banded as “Increasing is Better”. |
| Decreasing is Better | In general, the less the value of the Result the better. Usually if the Result is less than the Target it is considered to be a positive condition. For example, under most circumstances it is considered better to have decreasing costs. KPIs assessing cost topics are generally banded as “Decreasing is Better”. |
| Closer to Target is Better | In general, the closer the Result is to the Target the better. Usually if the Result is exactly the same value as the Target it is considered to be a positive condition. For example, under most circumstances meeting headcount targets as close as possible in a given period is considered better than either hiring too few people or hiring too many people. |
The Banding Method determines if actual values, normalized scale values or some other method is to be used to arrive at the Result value and Target value. Banding Method however does not determine how many bands are used. Many KPIs use three scoring bands because it is the simplest way to convey the relationship between a Target Expression and a Result Expression. The table below describes three KPI Banding Methods.
|
Banding Methods |
Assessment Criteria |
| Actual Values | Banding is done using the quotient of the Actual value divided by the Target value which is referred to as the Score. |
| Normalized Actual over Target | Banding is done using a Function that returns a normalized value between -1 and 1 where 1 is interpreted as “Result is very good” and -1 is interpreted as “Result is very bad”. |
| Stated Score | An advanced technique where stated scores may be systematically substituted for Actual and Target values. |
Summary
In this article we have attempted to show a way to extend the data architecture of business plans from the Ends and Means of the Business Motivation Model[viii] all the way to the Key Performance Indicator, a widely used Assessment tool for determining the success or failure of those plans.
[i] “Business Motivation Model, Version 1.0” published in August 2008 by the Object Management Group (OMG). For more refer to http://www.omg.org/ .
[ii] Influencers can have an impact on other types of Ends such as the enterprise’s Vision, and other types of Means like Mission and Directive as well.
[iii] Hay, Page 187.
[iv] Hay, page 187.
[v] The Zachman Framework for Enterprise Architecture.
[vi] See earlier references to the Perspectives of the Zachman Framework for Enterprise Architecture.
[vii] Courtesy of the “Boston About Results” program, Boston, MA, USA.
[viii] The Business Motivation Model, Business Governance in a Volatile World, The Business Rules Group, Copyright 2007, The Business Rules Group.
