Archive for the ‘Data Modeling’ Category

What Is a Data Model?

August 10, 2020

A data model is a great way to und myerstand the structure of a system. It requires the acceptance of the concept of an “entity”.  A data model depicts the relationships between the entities that make up a “real world” system.  A data model differs from a mathematical model in that it neither requires mathematical provability nor must it be expressed in numbers and symwbols as a mathematical model does.  A data model also differs from a process model in that it does not represent the dynamic changes in a system over time, it depicts the structure of a system, the way the parts of a system fit together.

A data model can be either a representation of the physical reality of a system or a non-physical representation. The latter is usually called either a “conceptual model” or a “logical model”.  Though both of these phrases mean something non-physical they are not completely interchangeable with one another.  A conceptual model is a model of ideas, while a logical model is a model of the semantic relationships between entities and requires a shared and agreed upon vocabulary for it to be useful. 

Machine Learning and Database Reverse Engineering

October 13, 2019

Artificial intelligence (AI) is based on the assumption that programming a computer using a feedback loop can improve the accuracy of its results.  Changing the values of the variables, called “parameters”, used in the execution of the code, in the right way, can influence future executions of the code.  These future executions are then expected to produce results that are closer to a desired result than previous executions.  If this happens the AI is said to have “learned”.

Machine learning (ML) is a subset of AI.  An ML execution is called an “activation”.  Activations are what “train” the code to get more accurate.  An ML activation is distinctly a two-step process.  In the first step, input data is conceptualized into what are called “features”.  These features are labeled and assigned weights based on assumptions about their relative influence on the output.  The data is then processed by selected algorithms to produce the output.  The output of this first step is then compared to an expected output and a difference is calculated.  This closes out the first step which is often called “forward propagation”.

The second step, called “back propagation” takes the differences between the output of the first step, called “y_hat” and the expected output, called “y” and, using a different but related set of algorithms, determines how the weights of the features should be modified to reduce the difference between y and y_hat.  The activations are repeated until either the user is satisfied with the output, or changing the weights makes no more difference.  The trained and tested model can then be used to do predictions on similar data sets, and hopefully create value for the owning party (either person or organization).

In a sense, ML is a bit like database reverse engineering (DRE).  In DRE we have the data, which is the result of some set of processing rules, which we don’t know[i], that have been applied to that data.  We also have our assumptions of what we think a data model would have to look like to produce such data, and what it would need to look like to increase the value of the data.  We iteratively apply various techniques to try to decipher the data modeling rules, mostly based on data profiling. With each iteration we try to get closer to what we believe the original data model looked like.  As with ML activation we eventually stop, either because we are satisfied or because of resource limitations.

At that point we accept that we have produced a “good enough model” of the existing data.  We then move on to what we are going to do with the data, feeling confident that we have an adequate abstraction of the data model as it exists, how it was arrived at, and what we need to do to improve it.  This is true even if there was never any “formal” modeling process originally.

Let’s look at third normal form (3NF) as an example of a possible rule that might have been applied to the data.  3NF is a rule that all columns of a table must be dependent on the key, or identifier of the table, and nothing else.  If the data shows patterns of single key dependencies we can assume that 3NF was applied in its construction.  The application of the 3NF rule will create certain dependencies between the metadata and the data that represent business rules.

These dependencies are critical to what we need to do to change the data model to more closely fit, and thus be more valuable for, changing organizational expectations.  It is also these dependencies that are discovered through both ML and DRE that enable, respectively, both artificial intelligence and business intelligence (BI).

It has been observed that the difference between AI and BI is that in BI we have the data and the rules, and we try to find the answers.  In AI we have the data and the answers, and we try to find the rules.  Whether results derived from either technology are answers to questions, or rules governing patterns, both AI and BI are tools for increasing the value of data.

These are important goals because attaining them, or at least approaching them, will allow a more efficient use of valuable resources, which in turn will allow a system to be more sustainable, support more consumers of those resources, and produce more value for the owners of the resources.

[i] If we knew what the original data model looked like we would have no need for reverse engineering.

Cross-mapping Business Data Elements with Physical Data Structures

September 12, 2018

ross-mapping[i] business data elements (BDEs) from requirements or business glossaries all the way through to the physical data structures that store these data elements can be tricky.  This process is made easier if a logical data model (LDM) is implemented between the business side and the technology model upon which the physical implementation is based.

In this article I will show two styles of cross-mapping between the BDEs of the business glossary and the data storage structures defined in the physical data model (PDM).  The two styles are called “Column Style” mapping and “Cell Style” mapping.

Column Style can apply to the cross-mapping of BDEs with both base tables[ii] and reference tables.  Cell Style mapping takes Column Style a step further for reference data and maps the individual values of a reference BDE to individual cells, or row column coordinates, in the database.  If each reference value needs to be implemented in the technology separately a Cell Style mapping is needed.

Also some BDEs are atomic in that there is no inherent structure in the business data element.  I call these Simple BDEs.  Some BDEs have an inherent structure which depends on the scope of their business definition.  These structures are often in the form of a container and its contents.  I call these Compound BDEs.

Some examples of each style follow.  Figure 1 shows an example of a Column Style mapping of a Simple BDE[iii] to a single Column of a single base Table in the database.  Using the terms “Table” and “Column” gives the impression that these mapping styles apply only to relational databases.  This is not true.  The concepts here can apply to “NoSQL” databases as well, such as Key-Value Stores, Column Family Databases and Document Databases.  These types of databases have been referred to as Aggregate-Oriented Databases.[iv]

Figure 1.

Figure 2 shows a Column Style mapping of a Simple BDE to a single Column of a single reference Table in the database.  Note here that because it is a reference data mapping that the valid values of the reference BDE do not get specifically mapped to any structure or data in the database.  In this case the valid reference values may be defined and maintained in the business glossary in an appropriate manner but there is no explicit mapping link between them and any thing in the data model or database.  Also note that I am not saying that the reference values are not in the database.  They almost certainly are, since the applications would presumably not function properly if they were not.  But the values themselves (“Unknown”, “IFRS”, US GAAP”, etc.) are not considered BDEs.

Figure 2.

Figure 3 is a Column Style mapping of a Compound BDE to multiple Columns of a base Table in the database.  Note here that the BDE maps to two Columns in the same Table.  It could, of course, map to only one Column, or to many more Columns in many more Tables.  The point of this example is not how may times the BDE maps to various Columns but that it is a Compound BDE.  “Current Assets.Cash”[v] really identifies two business concepts, “Current Assets” which is a section of a financial statement, and “Cash” which is the most liquid kind of asset.  In terms of a financial statement, cash is a type of current asset.  For whatever reason, probably because cash itself can occur in multiple contexts, the business found it necessary to identify the financial statement use of cash in its own BDE.  Cash could also, for example, be a type of transaction, which would be another BDE.

Figure 3.

In Figure 4 we have an example of Cell Style mapping.  Here, the same Compound BDE that was used in Figure 3, “Current Cash.Assets” is broken apart into its two separate parts, and each is mapped with a different Column in a different reference Table in the database.  Both of these tables are reference Tables.  One contains the name of the types of financial statement templates used by the system (financial_statement_templates) to which “Current Assets” is mapped.  The other contains the names of the types of lines on those financial statements (financial_statement_line_templates) to which “Cash” is mapped.  It is unlikely that “Current Assets” would be mapped to multiple database Columns, but because of the multiple meanings of “Cash” there could be multiple mappings between it and multiple database Columns.

Figure 4.

Note that Cell Style mapping requires mapping to the data content of the database and not just its structure, or metadata.  This needs to be taken on with great caution and requires a consensus for how the words (e.g. “Cash”) used in the glossary are conveyed to and used in the Transaction Activity Data[vi] of the database to determine the actions of any application accessing the data.  Cash is simple, but any time you rely on reading a string to determine a code path you create an external dependency in the code.  However, if the business changes the name of a Cell Style mapped BDE there should be a documented path to where and how that value is used by any application that accesses it in the database.  This fact alone makes any system more maintainable and sustainable.


[i] The word “cross-mapping” is used to imply that the mapping goes both ways, from business to technology, and from technology to business.  This allows the documentation of the system to more accurately describe the entire enterprise architecture by creating valid and traceable links back and forth between the business architecture and the technical architecture.  By creating an interface between the two aspects of the enterprise architecture, business people can more confidently make decisions based on the data they see, knowing with confidence it is reliably stored and processed, and technical people can more confidently know the data they collect, manipulate and provide does in fact represent what business side intends for it to be.

[ii] I use the term “base table” here to refer to the realization of the bottom four of the six layers of data described by Malcolm Chisholm in his article “What is Master Data” originally published February 6, 2008.  http://www.b-eye-network.com/view/6758 .  These include Enterprise Structure Data, Transaction Structure Data, Transaction Activity Data and Transaction Audit Data.

[iii] The numbers (128, 600 and 1) that follow the name of each BDE in the examples are purely arbitrary and are there only to indicate that BDE’s should be numbered in the catalog for indexing purposes.

[iv] See Pramod J. Saladage and Martin Fowler, NOSQL Distilled, A Brief Guide to the Emerging World of Polyglot Persistence, Addison-Wesley, 2013.

[v] Note the “.” Between Current Assets and Cash.  This is just to make it easier the tell that the BDE is compound.  Don’t count on always having a separator between the parts of a Compound BDE.  The glossary tool may simply not support it or the in-depth analysis to identify the two parts may not have been made.  As a data modeler you may have to do this analysis yourself.

[vi] Please refer to note ii above.


Identifying Motivators (“Why”)

February 22, 2018

This is the sixth and final post in this series about how to identify entities in data sources that can readily be classified as belonging to each of the 6BI Business Object Categories (BOCs): Parties, Things, Activities, Locations, Events and Motivators. The fifth post in the series (about Events, the “When” aspect) can be found at https://birkdalecomputing.com/2018/01/30/identifying-events-when/ .

The Motivators BOC is probably the most nuanced and least understood BOC. I have earlier devoted an entire article about the meta-data structure of motivators entitled “The Data Architecture of Business Plans”[i] which can be found at https://birkdalecomputing.com/6bi-home/the-data-architecture-of-business-plans/ .

The Motivators BOC identifies Why things get produced and consumed by parties.  Concepts and objects in this BOC capture data about the ends, means, influencers and assessments that provide the reasons why parties exchanged things (products and money) at a particular time and place.  Ends and means are in general too abstract to be found in object names, but you will find names such as Strength, Weakness, Opportunity, Threat, and Key Performance Indicator (KPI) all of which are assessment elements.

Data element and data element collection names you may encounter that belong to the Motivators BOC include, but are not limited to, names in the following table[ii]. The list gives you a hint of what kind of names to look for in putting together a 6BI Analytic Schema for enabling your data to answer business questions.

In terms of identifying motivator data elements (i.e. attributes and columns) and motivator data element collections (i.e. entity types and tables) the most likely candidates are documents, or at least those objects that have the word Document in their name.  You need to consider documents, because it is quite often that you will find the means (missions and courses of action) of an enterprise described in document form, especially if the document name contains words such as Strategy/Strategic, Tactic, Enablement/Enabled, Directive, Policy or Rule.  The ends of an enterprise (visions and desired results) can also be described in a document, quite often having a name like Goal or Objective.

As mentioned in the post about the Things BOC[iii], a document can also be considered a type of thing, such as a definition.  As in “the definition” is being assessed for accuracy, for example.  However, if its purpose is to contain text that describes means or ends it also belongs to the Motivators BOC.  An event can also be a motivator such as Appeal and Campaign.  But as was mentioned in the Events BOC, events are primarily differentiated from other concepts and objects by their inclusion of a time data element, either a point in time or a duration.

Another source of motivators is reference data.  Reference data can describe business functions (see the post on the Activities BOC) and often determines choices that users make on user interfaces which then determine logic paths that an application will take when processing data and thus explain why certain results are derived.  Example data element and data element collection names that often become the basis of reference data management (RDM) include: Code, Type, Tag, Status and Class/Classification.  Often you may find these name in plural form as well.

So, if you are analyzing a legacy database and you come across a table with any of these words in its name you need to study the content of the table and understand how the rows and columns of the table effect, or are designed to effect, the motivation for actions taken by the parties in the organization.

The Motivators BOC is especially relevant to the type of NOSQL database known as a document database, Mongo DB being a prime example.  It is one thing to structure and access the data in a document store in an effective and efficient manner but, in terms of answering business questions, it is even more important to know what role the content of the document plays in the operation of the enterprise.  In other words, how does or how should the document provide the answer to “why” a business transaction took place between parties.

Another category of motivators deals with security and privacy, and sometimes is included in policies and procedures.  Names here include Authorization, Enforcement and Permission, among others.  The intersection between business motivation and security is ripe for further exploration.

This is the last post in this series.  I hope you will find them worthwhile and useful. To find each one just click the link in the first paragraph of each to take you to the previous one. The first in the series about the Parties BOC can be found at https://birkdalecomputing.com/2017/04/26/identifying-parties/ .

Thanks for reading them and best of luck in developing your 6BI Analytic Schemas.


[i] The title “The Data Architecture of Business Plans” is derived from the fact that Business Plans are the deliverable of the Motivation aspect (the “Why” interrogative) at the Business Management, or Conceptual perspective of the Zachman Framework for Enterprise Architecture.

[ii] As previously, I would like to thank Barry Williams and his excellent Database Answers website http://www.databaseanswers.org/data_models/ for providing many of the table name examples.

[iii] https://birkdalecomputing.com/2017/05/04/identifying-things/

Identifying Events (“When”)

January 30, 2018

This is the fifth in a series of posts about how to identify entities in data sources that can readily be classified as belonging to each of the 6BI Business Object Categories (BOCs): Parties, Things, Activities, Locations, Events and Motivators.  Entity types in the Events BOC identify When production and consumption of things by parties occurs. The fourth post in the series (on Locations, the “Where” aspect) can be found at https://birkdalecomputing.com/2017/08/23/identifying-locations/ .

Concepts and objects in this BOC capture data about a point in time or the duration of time over which products or payments flow from one party to another, or when an enterprise carries out its work. Data element and data element collection names you may encounter that belong to the Events BOC include, but are not limited to, names in the following table[i]. The list gives you a hint of what kind of names to look for in putting together a 6BI Analytic Schema for enabling your data to answer business questions.

Events break down into two major sub-types: (1) Occurrence types, which include EventAlert, Notification, and Incident from the list above; and (2) Duration types which include, Year, Month, Week, Day, Hour, Minute, Second, Date and Time from the list.  Duration type entities, as no doubt is obvious, are units of time and can be used to aggregate facts in a star schema across a temporal hierarchy.  Occurrence types are more like things.  Instead of being produced and consumed, they occur, that is they are something that can be referred back to that, in addition to any other properties they may have, always have an aspect of time or “when” about them, this aspect is important for data analysis.

Unlike the other BOCs, the Events BOC has both dimensional and fact characteristics.  On the one hand, time is already defined into a hierarchy and is standard for everyone.  An hour is always an hour, sixty minutes, a minute is always a minute, sixty seconds, and so on.  On the other hand event occurrences are things that happen and can be measured and compared.  They are data, not metadata as the hierarchy of time is.  Events happen and then they are over but there can be much to learn from their having occurred. This BOC is conceived to capture important data about the perspectives of when something happens in your data.  These perspectives relate to when, not where, not who, not how, not why, not even what has happened, but when it happened, or will happen.

This BOC captures the characteristics of time that most influence results.  It is also important to understand how events differ from either locations or activities, two other previously covered BOCs, with which events are often confused.

A location is concrete.  It is a point in space, a place, even if that space is virtual. You can go away and come back to a location, and if most (not necessarily all) other factors are the same, or within tolerances, the location is still there.  Not so with an event.  An event, though all relevant data may be captured about it, once it occurs, is done and goes away forever.  Another instance of a particular class of events can subsequently occur, but each event is unique and has a time when it occurred.

Events and activities are closely related and co-dependent but are not the same.  Activities are event-driven.  They receive and react to events and create new events which are sent to other activities.  Each activity is an independent entity and can execute in parallel with other activities.  Coordination and synchronization is by means of events communicated between the activities.  Activities react to input events by changing state and creating output events[ii].

The important thing, from a 6BI perspective is that an event provides a temporal association for a result.  If the persons, places, products, locations, and motivators are known (or estimated) you still need to know when these aspects came together to create something of significance.

Another instance of the importance of the “When” aspect is in Big Data solutions.  Since systems owners often cannot control when data is available to the solution it is important to be able to record when each event occurs, and there could be literally millions of events in a short unit of time producing results which can uniquely aggregate the results.

[i] I would like to thank Barry Williams and his excellent Database Answers website http://www.databaseanswers.org/data_models/ for providing many of the table name examples.

[ii] David Luckham, various writings.

6BI and Marketing Attribution

December 26, 2017

Six Basic Interrogatives (BI) can be used to analyze marketing attribution. In marketing, attribution is the assigning of credit to the interactions in the sequence of interactions which have led up to what is called a conversion[i].  A conversion is an action, or event which results in an action, that has value for the means of interaction, the campaign, which is seen to be the motivator of the visitor’s interactions and eventual conversion. The interactions take place through channels which when associated with a campaign are called touchpoints.

To pursue the most effective marketing strategy it is important to know which touchpoints, and in what sequences they occur, are the most likely to result in conversions.  A typical scoring system to assess these sequences of actions consists of assigning credit to the touchpoints in a sequence according to some attribution rule or rules.  There are several popular attribution rules in use across the field of marketing analytics.  These rules fall into three broad categories.[ii]

  • Single Source Attribution (Single Touch Interaction) models assign all the credit to one event, such as the last click, the first click or the last channel to show an ad. Simple or last-click attribution is widely considered as less accurate than alternative forms of attribution as it fails to account for all contributing factors that led to a desired outcome.
  • Fractional Attribution (Multi-Touch Interaction) includes equal weights, customer credit, and multi-touch / curve models. Equal weight models give the same amount of credit to all events, customer credit uses past experience and sometimes simply guesswork to allocate credit. Multi-touch assigns various credit across all the touchpoints in set amounts.
  • Algorithmic Attribution uses statistical modeling and machine learning techniques to derive probability of conversion across all marketing touchpoints which can then be used to weight the value of each touchpoint preceding the conversion. Algorithmic attribution analyzes both converting and non-converting paths across all channels to determine probability of conversion. With a probability assigned to each touchpoint, the touchpoint weights can be aggregated by a dimension of that touchpoint (channel, campaign, interaction placement, visitor type, content type, etc.) to determine a total weight for that dimension.

Examples of each category of attribution model include the following:

Single Source Attribution[iii]

  • The Last Interaction model attributes 100% of the conversion value to the last channel with which the customer (or visitor) interacted before buying or converting.
  • The Last Non-Direct Click model ignores direct traffic and attributes 100% of the conversion value to the last channel that the customer clicked through from before buying or converting. Google Analytics uses this model by default when attributing conversion value in non-Multi-Channel Funnels reports.
  • The Last AdWords Click model attributes 100% of the conversion value to the most recent AdWords ad that the customer clicked before buying or converting.
  • The First Interaction model attributes 100% of the conversion value to the first channel with which the customer interacted.

Fractional Attribution[iii]

  • The Linear model gives equal credit to each channel interaction on the way to conversion.
  • The Time Decay model may be appropriate if the conversion cycle involves only a short consideration phase. This model is based on the concept of exponential decay and most heavily credits the touchpoints that occurred nearest to the time of conversion. The Time Decay model could have half-life of 7 days, meaning that a touchpoint occurring 7 days prior to a conversion will receive 1/2 the credit of a touchpoint that occurs on the day of conversion. Similarly, a touchpoint occurring 14 days prior will receive 1/4 the credit of a day-of-conversion touchpoint.
  • The Position Based model allows you to create a hybrid of the Last Interaction and First Interaction models. Instead of giving all the credit to either the first or last interaction, you can split the credit between them. One common scenario is to assign 40% credit each to the first interaction and last interaction, and assign 20% credit to the interactions in the middle.

Algorithmic Attribution[iv]

Algorithmic attribution is a more advanced way to model attribution data in order to most accurately represent the visitor interaction event flow.  Algorithms tend to be proprietary so what factors are considered in the algorithm and what weight each factor gets can vary by attribution provider.  However, the most accurate algorithmic attribution models use machine learning to intake vast amounts of data, all of the touchpoints, both historical and going forward, that went into closed-won deals, closed-lost deals, deals that fell apart at or before the opportunity stage, etc. to create enterprise specific models.

The algorithm then creates custom weights for each of your stages to represent how your visitors go through the funnel. It’s important to note that it should also use new data as you continue to engage prospects and close deals to refine and improve the model, which is the machine learning aspect.

The 6BI Analytics Schema in Figure 1 lays out the fundamental base entities that support marketing attribution.  This diagram also enumerates the process by which business value is extracted from that schema. Keep in mind this is a high level logical data model (LDM) and certainly not intended to be sufficient for generating database tables without far more domain specific modeling.
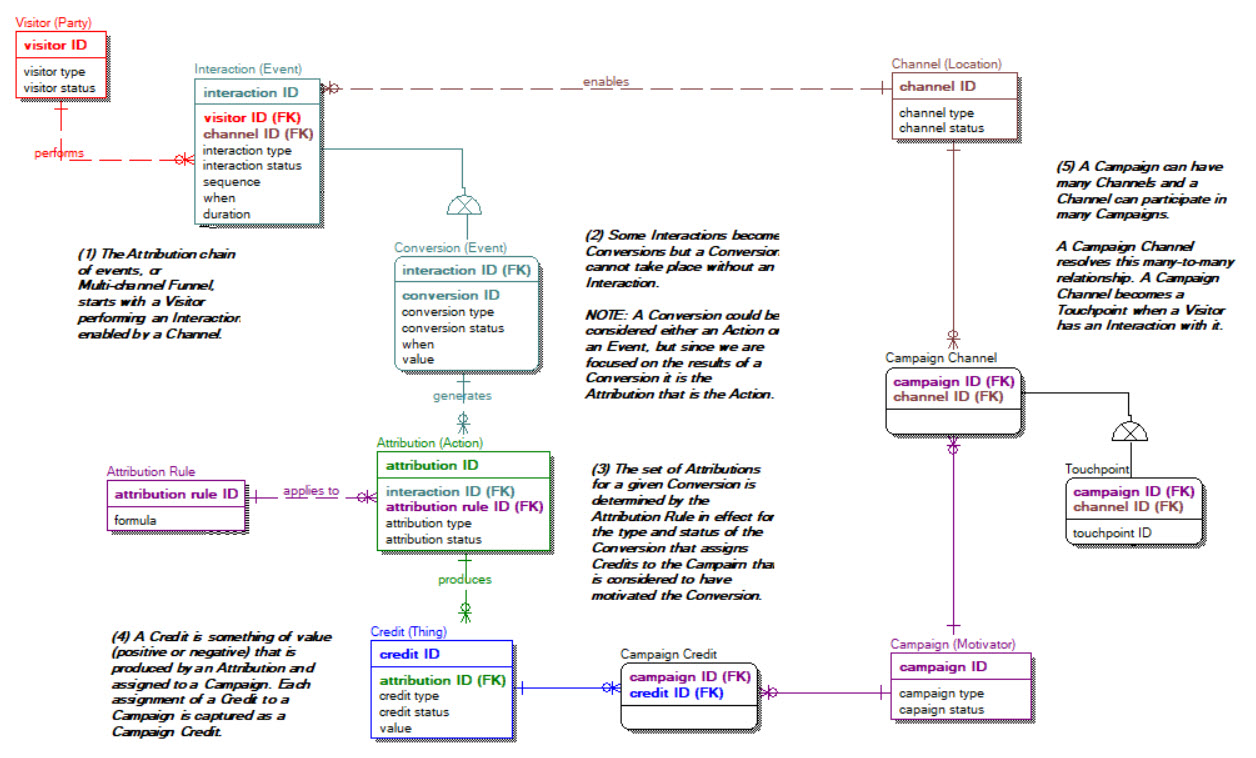
Figure 1.


From a 6BI perspective the Visitor is a type of Party because it represents “who” initiates the sequence of events.  Interaction and its sub-type Conversion are types of Events, they identify “when” an action takes place.  Credit, a type of Thing, more specifically a Thing of Value to the campaign is “what” the action produces.  Attribution, a type of Action, is “how” a credit is produced.  The Channel, a type of Location is “where” the events occurred. The assumption as to “why” the visitor interacts and converts is due to the influence of a Campaign, which is a type of Motivator.

The assigning of Campaign Credits to Campaign Channels is identified in Figure 1 by a series of five (5) steps.  This process begins with a Visitor performing a type of Interaction, through a Channel, which causes it, the Interaction, to become a Conversion.  The Conversion generates Attributions which, based on the application of an Attribution Rule produce Credits which are assigned to a Campaign. The use of a Channel by a Campaign identifies the Touchpoints which ultimately get evaluated based on how much Credit they produce for the Campaign.

To get the net benefit of attribution you need to capture the cost side as well. You need to know and use, in your assessments, not only the costs of applying the attribution rules, but the costs of channels, touchpoints, impressions and campaigns as well.  Not only do you need to determine how much influence, for example, your Paid Search feed had in generating conversions when it was the second touchpoint, but the cost of the Paid Search feed service to your enterprise as whole.[v]

The goal of attribution is to determine which touchpoints are producing a positive result, and, by using the cost of each touchpoint, an attribution system can then show which touchpoints are profitable. This allows optimization of marketing expenditures.[vi]


[i] Conversion is a generalized term for the desired result of a marketing effort. This can include other actions besides sales such as sign-ups, survey completions, favorable ratings, etc.

[ii] https://en.wikipedia.org/wiki/Attribution_(marketing)

[iii] https://support.google.com/analytics/answer/

[iv] https://www.bizible.com/

[v] The cost of a touchpoint might vary depending on whether it is first, last or some intermediate (assisting) interaction in the conversion event flow.

[vi] https://www.convertro.com/

Identifying Locations (“Where”)

August 23, 2017

My apologies for the long delay since the last post in this series, but the real world got in the way, in the form of a job opportunity I just could not say “no” to.

This is the fourth in a series of posts about how to identify entities in data sources that can readily be classified as belonging to each of the 6BI Business Object Categories (BOCs): Parties, Things, Activities, Locations, Events and Motivators.  The third post in the series (on Activities, the “How” aspect) can be found at https://birkdalecomputing.com/2017/05/24/identifying-activities/.  Please note also that I changed the order of Locations and Events because I want to discuss Locations next and save until last what I consider to be the two most complex BOCs, Events and Motivators.

The Locations BOC identifies Where things get produced and consumed by parties.  Concepts and objects in this BOC capture data about, not only physical locations, but virtual locations as well.  Data element and data element collection names you may encounter that belong to the Locations BOC include, but are not limited to, names in the following table[i].  The list gives you a hint of what kind of names to look for in putting together a 6BI Analytic Schema for enabling your data to answer business questions. 

Usage often determines whether Location or Thing is the appropriate BOC for any given object or concept.  For example, Webpage, Portal, Database, and Dashboard are all objects that depend on context and can either be a thing or describe where a thing is located.  Also, Document, Source and Destination can designate places as well as being things.  The key to the Locations BOC is to include only those objects and/or concepts that actually refer to a Place or a Site, and not to just the description of the place or the site.  The Sites and Addresses are synonymous and can be either physical or virtual.

Locations exist whether we use them or not.  However, it is usually, at least for business purposes, only when a member of one of the other BOCs, usually parties or things, is placed at a specific site when an activity or event occurs that locations become relevant. This can best be determined if you ask yourself how important is it to know where some activity took place, where an event or where some party or thing is located.  Does being located at one site as opposed to any other site make a difference?  Is the measurement of performance impacted by the site of one or more of the objects or concepts under consideration.  If the answer is “yes” within the context being considered then location is a factor to consider in our data analysis.

Locations are often nested hierarchies as in Country, Region, State, County, City, Street, Postal Code, ZoneBuilding, etc.  This hierarchy impacts the level of aggregation of the data.  The larger the scope of the location, or the further apart the sites are within a given level of the hierarchy, generally the more parties and things are included.  The more of these objects and concepts (parties and things) are included in the measurement the less likely the details of any one specific party or thing will influence the data at that level.  This is an application of the law of large numbers. This fact is one reason why it is important to be able is dis-aggregate your data when it is needed.  Enterprise performance is measured by buying and selling lots of things, but those large numbers are generated one item at a time as often as not.

[i] I would like to thank Barry Williams and his excellent Database Answers website http://www.databaseanswers.org/data_models/ for providing many of the table name examples.


Identifying Activities (“How”)

May 24, 2017

This is the third in a series of posts about how to identify entities in data sources that can readily be classified as belonging to each of the 6BI Business Object Categories (BOCs): Parties, Things, Activities, Events, Locations and Motivators.  The second post in the series (on Things, the “What” aspect) can be found at https://birkdalecomputing.com/2017/05/04/identifying-things/ .

The Activities BOC identifies How things get produced and consumed by parties. Concepts and objects in this BOC capture data about the means by which products or payments flow from one party to another, or how an enterprise carries out its work[i].  Data element and data element collection names you may encounter that belong to the Activities BOC include, but are not limited to, names in the following table[ii].  The list gives you a hint of what kind of names to look for in putting together a 6BI Analytic Schema for enabling your data to answer business questions.

An Activity is the most general super-type, in this BOC, encompassing Function and Process[iii].  Functions are intended to describe how an organization’s mission is planned to be carried out, and Processes describe how the mission is made real.  In the design of the Analytic Schema, data that identify and describe functions is almost always used in the source system as a type of reference data and will typically be brought into the Analytic Schema as text data in dimension members.  The maintenance of this data should be under the control of Data Governance.  The governance of data is itself both a function and a process and as such its performance can also be measured.  If one were to design a schema for measuring the performance of the Data Governance function a hierarchical collection of its sub-functions would be identified.  As we will see, functions also play a significant role in the Motivators BOC, but that will come later.

In data modeling, I have observed that we will more often model processes than functions.  A process can be either a Business_Process or a System_Process, but in either case the “process” is how something gets done.  This is accomplished by transforming either concepts or objects (or both) into different states.  It is the contribution of this transformation toward some goal that we need to measure.  Keep in mind it is “how” something gets done that we are measuring here, not “what” gets done.  This is vitally important to analytics and business intelligence because there is a lot of potential gain in improving how something is done, even if  what is produced (or consumed) remains unchanged.  For example, decreasing processing time, reducing waste and realigning responses to demand are all readily actionable.  For marketing purposes, how a product is produced or provided [iv] disappears into the product itself, and so is quite often overlooked as a separate factor in measurement.  In business systems quite often the names we look for to identify activities contain the word Transaction in some way.

Another feature of a process is that it transforms things, and these transformations usually take place via some Mechanism.  Mechanisms include Sales, Purchases, Receiving and Shipments.  A process can also be represented by a document such as a Request, an Order, an Invoice, a Manifest, or a Receipt.  It is the data about the transformation, perhaps recorded in a document, or perhaps not, that we want to measure.  We measure the impact on the parties and things participating in the transformation and not the parties and things themselves.  This is a subtle but important difference.  An activity’s quantities, values and description are the record of “How” the process produced a result.

An activity is often the source of one or more events, and an event is often the source of one or more activities, but activities and events are not exactly the same thing, and are not interchangeable. We will visit the Events BOC in a future post.

[i] David C. Hay, Data Model Patterns, A Metadata Map, 2006.

[ii] I would like to thank Barry Williams and his excellent Database Answers website http://www.databaseanswers.org/data_models/ for providing many of the table name examples.

[iii] David C. Hay, Data Model Patterns, A Metadata Map, 2006.

[iv]  The distinction between “produced” and “provided” is made to distinguish between, for example, manufacturing and retailing.

Identifying Things (“What”)

May 4, 2017

This is the second post in a series of posts about how to identify entities in data sources that can readily be classified as belonging to each of the 6BI Business Object Categories (BOCs): Parties, Things, Activities, Events, Locations and Motivators.  The first post in the series (on Parties, the “Who” aspect) can be found at   https://birkdalecomputing.com/2017/04/26/identifying-parties/ ‎.

The Things BOC identifies What the concepts and objects are that are produced and consumed by parties.  Data element and data element collection names you may encounter that belong to the Things BOC include but are not limited to names in the following table[i].  The list gives you a hint of what kind of names to look for in putting together a 6BI Analytic Schema for enabling your data to answer business questions.

For the purposes of 6BI the first decomposition of Things is between Product and Payment.  Products are also further decomposed into Good and Service.  Goods are tangible material products for which consumers make payments, and services are products provided primarily by human or human-like labor.  Products are also quite often hierarchical and the names used for each level are Things BOC names in their own right.  These names can be logical such as Class, Category, and Type for example. Or can be physical such as Assembly, Component, and Container.  Look for these words, or ones like them, in conjunction with other words that more clearly designate them as classification levels of a product, such as Asset_Type or Vehicle_Assembly.  Products and Payments represent what is exchanged in a transaction and are differentiated by the direction in which they flow.  Products flow from provider to consumer, and Payments flow from consumer to provider.  Quite often the difference between a Product and a Payment is obvious, but sometimes it’s not.  This is especially true when transactions are “in kind” and it is not obvious which, if either thing, represents the “money”.  One rule of thumb is to always remember who the “first party”[ii] in your analysis and which side of their ledger you are analyzing.  The first party is for “whom” the analysis is done or “who” the analysis is intended to benefit.  If you are analyzing their receivables side then the inflow is always a payment and the outflow a product.  If you are analyzing their payables side then the opposite is true, inflows are product types and outflows are payment types.

Potentially the Things BOC can be identified by more data store names than any other BOC because we as humans often designate all phenomena as things.  In information systems however it is always more useful to refer to the instances of the Things BOC as products or payments.  We use the term “Things” for this category of business objects so that we remember to look at both sides of “what” is being exchanged in a transaction, and not be content to only consider the product alone.  There are simply so many things in the real world but we must concentrate on “how” (see the Activities BOC post) they flow if we need to measure their value to a party and assess a party’s contribution to that value.

A Definition can also be a product. This is true when used to represent the meaning of that which parties (individuals and organizations) produce or consume.  It doesn’t matter what is defined.  It can be a party, a location, an activity, an event, a motivator or anything.  If the definition itself is manipulated (i.e. produced or consumed by a party) then it is a product, and thus a thing.  We can speak about the “Definition of the customer” for example.  Customer is clearly a member of the Parties BOC when it comes to analyzing data content for understanding performance for example.  But the definition itself (i.e. What a customer is) is a product of a metadata system.  If you need to analyze, normalize and rationalize the consistency of various definitions of customer you need to treat these definitions as things and not as parties.  That is, they are products of the system associated with a provider and a consumer.

The customer can have multiple definitions, but each separate definition must be associated with the customer through some unique combination of location, event, activity and/or motivator.  Those for whom the consistency checking and improving is performed are the parties. However, and this is critical, the definition of what a customer is, so that it can be used consistently to mean the same role played by a party depending on some unique combination of activity, location, event, product, and motivator is itself a product.  As a product, its quality can be controlled and monitored, its accuracy and integrity assessed and its use measured.

[i]  I would like to thank Barry Williams and his excellent Database Answers website http://www.databaseanswers.org/data_models/ for providing many of the table name examples.

[ii] The party from whose perspective the measurements are taken.


Identifying Parties (“Who”)

April 26, 2017

This is the first of a series about how to identify entities in data sources that can be readily classified as belonging to each of the 6BI Business Object Categories (BOCs): Parties, Things, Activities, Events, Locations and Motivators. I will start with Parties.

The Parties BOC (Business Object Category) identifies Who produces or consumes objects and concepts.  Examples of commonly used data element[i] and data element collection[ii] names you may encounter in diverse types of data stores, that can be categorized under the Parties BOC, include but are not limited to those in the table below.[iii] They contain names commonly used to identify entities (e.g. tables in an RDBMS and documents in a DDBMS) and attributes (e.g. columns in tables and fields in documents). The list gives you a hint of what kind of names to look for in putting together a 6BI Analytic Schema for enabling your data to answer business questions.

Telling providers from consumers is important to recognize because it will tell you in which direction the product flows and in which direction the payment flows.  Knowing this provides the basis for profitability and resource use efficiencies. Producing parties include such names as Producer, Provider, Seller, Supplier, Broker, Vendor for example. Examples of consuming party names include Consumer, Payer, Receiver, Buyer, Client, Customer.  A Parties BOC name can also identify third parties such as Obligee, Specialist and Agency.  Parties can be animate (Citizen, Patient) or inanimate (Bureau, Department). They can be collective (Organization) or singular (Person). These are some of the names you should look out for in analyzing source data systems. They can be names of data element collections (e.g. tables) and/or names of data elements (e.g. columns). Generally, they hold data about the object types within the Parties BOC which can then be used in answering the Who interrogative component of any query.  Parties often come in pairs, the parties that produce or provide, and the parties that consume or pay. Thus, it is important that when you discover one or more Parties BOC entity in your source data that you ask the question, “Is this a producer or a consumer”?  Of course, a single entity can be both a producer and a consumer depending primarily on the type of thing being measured and the type of activity that causes it to need to be measured. If a “first-party” (i.e. the party from whose perspective the measurements are taken) pays money in the transaction it will be the “consumer” in the scope of the transaction being analyzed. Otherwise the party is the “producer” in some manner and its performance will be measured by some assessment of relative value between product outflow and money inflow. Quite often both providers and consumers will be assessed in some manner, usually by an Assessor, as a result of the measurements.

With the advent of the Internet of Things (IoT) the Role that a device plays in producing and consuming data now means that the Parties BOC includes non-traditionally human parties as well. As a matter of fact entities that previously were only considered as part of the Things BOC can now be parties. The concept of a party has gone beyond the traditional definitions of people and organizations but it still, at the end of the day, remains the producer and consumer of data.

[i] Wikipedia defines any unit of data defined for processing as a data element. Since 6BI deals with the meaning of data elements it is generally non-productive to consider any unit smaller than an attribute or field.

[ii] A data element collection is a set of related attributes or fields. Depending on the degree of normalization they are usually co-located in a container called a table or a document.

[iii] I would like to thank Barry Williams and his excellent Database Answers website http://www.databaseanswers.org/data_models/ for providing many of the table name examples.