Identifying Locations (“Where”)

August 23, 2017

My apologies for the long delay since the last post in this series, but the real world got in the way, in the form of a job opportunity I just could not say “no” to.

This is the fourth in a series of posts about how to identify entities in data sources that can readily be classified as belonging to each of the 6BI Business Object Categories (BOCs): Parties, Things, Activities, Locations, Events and Motivators.  The third post in the series (on Activities, the “How” aspect) can be found at https://birkdalecomputing.com/2017/05/24/identifying-activities/.  Please note also that I changed the order of Locations and Events because I want to discuss Locations next and save until last what I consider to be the two most complex BOCs, Events and Motivators.

The Locations BOC identifies Where things get produced and consumed by parties.  Concepts and objects in this BOC capture data about, not only physical locations, but virtual locations as well.  Data element and data element collection names you may encounter that belong to the Locations BOC include, but are not limited to, names in the following table[i].  The list gives you a hint of what kind of names to look for in putting together a 6BI Analytic Schema for enabling your data to answer business questions. 

Usage often determines whether Location or Thing is the appropriate BOC for any given object or concept.  For example, Webpage, Portal, Database, and Dashboard are all objects that depend on context and can either be a thing or describe where a thing is located.  Also, Document, Source and Destination can designate places as well as being things.  The key to the Locations BOC is to include only those objects and/or concepts that actually refer to a Place or a Site, and not to just the description of the place or the site.  The Sites and Addresses are synonymous and can be either physical or virtual.

Locations exist whether we use them or not.  However, it is usually, at least for business purposes, only when a member of one of the other BOCs, usually parties or things, is placed at a specific site when an activity or event occurs that locations become relevant. This can best be determined if you ask yourself how important is it to know where some activity took place, where an event or where some party or thing is located.  Does being located at one site as opposed to any other site make a difference?  Is the measurement of performance impacted by the site of one or more of the objects or concepts under consideration.  If the answer is “yes” within the context being considered then location is a factor to consider in our data analysis.

Locations are often nested hierarchies as in Country, Region, State, County, City, Street, Postal Code, ZoneBuilding, etc.  This hierarchy impacts the level of aggregation of the data.  The larger the scope of the location, or the further apart the sites are within a given level of the hierarchy, generally the more parties and things are included.  The more of these objects and concepts (parties and things) are included in the measurement the less likely the details of any one specific party or thing will influence the data at that level.  This is an application of the law of large numbers. This fact is one reason why it is important to be able is dis-aggregate your data when it is needed.  Enterprise performance is measured by buying and selling lots of things, but those large numbers are generated one item at a time as often as not.

[i] I would like to thank Barry Williams and his excellent Database Answers website http://www.databaseanswers.org/data_models/ for providing many of the table name examples.


Identifying Activities (“How”)

May 24, 2017

This is the third in a series of posts about how to identify entities in data sources that can readily be classified as belonging to each of the 6BI Business Object Categories (BOCs): Parties, Things, Activities, Events, Locations and Motivators.  The second post in the series (on Things, the “What” aspect) can be found at https://birkdalecomputing.com/2017/05/04/identifying-things/ .

The Activities BOC identifies How things get produced and consumed by parties. Concepts and objects in this BOC capture data about the means by which products or payments flow from one party to another, or how an enterprise carries out its work[i].  Data element and data element collection names you may encounter that belong to the Activities BOC include, but are not limited to, names in the following table[ii].  The list gives you a hint of what kind of names to look for in putting together a 6BI Analytic Schema for enabling your data to answer business questions.

An Activity is the most general super-type, in this BOC, encompassing Function and Process[iii].  Functions are intended to describe how an organization’s mission is planned to be carried out, and Processes describe how the mission is made real.  In the design of the Analytic Schema, data that identify and describe functions is almost always used in the source system as a type of reference data and will typically be brought into the Analytic Schema as text data in dimension members.  The maintenance of this data should be under the control of Data Governance.  The governance of data is itself both a function and a process and as such its performance can also be measured.  If one were to design a schema for measuring the performance of the Data Governance function a hierarchical collection of its sub-functions would be identified.  As we will see, functions also play a significant role in the Motivators BOC, but that will come later.

In data modeling, I have observed that we will more often model processes than functions.  A process can be either a Business_Process or a System_Process, but in either case the “process” is how something gets done.  This is accomplished by transforming either concepts or objects (or both) into different states.  It is the contribution of this transformation toward some goal that we need to measure.  Keep in mind it is “how” something gets done that we are measuring here, not “what” gets done.  This is vitally important to analytics and business intelligence because there is a lot of potential gain in improving how something is done, even if  what is produced (or consumed) remains unchanged.  For example, decreasing processing time, reducing waste and realigning responses to demand are all readily actionable.  For marketing purposes, how a product is produced or provided [iv] disappears into the product itself, and so is quite often overlooked as a separate factor in measurement.  In business systems quite often the names we look for to identify activities contain the word Transaction in some way.

Another feature of a process is that it transforms things, and these transformations usually take place via some Mechanism.  Mechanisms include Sales, Purchases, Receiving and Shipments.  A process can also be represented by a document such as a Request, an Order, an Invoice, a Manifest, or a Receipt.  It is the data about the transformation, perhaps recorded in a document, or perhaps not, that we want to measure.  We measure the impact on the parties and things participating in the transformation and not the parties and things themselves.  This is a subtle but important difference.  An activity’s quantities, values and description are the record of “How” the process produced a result.

An activity is often the source of one or more events, and an event is often the source of one or more activities, but activities and events are not exactly the same thing, and are not interchangeable. We will visit the Events BOC in a future post.

[i] David C. Hay, Data Model Patterns, A Metadata Map, 2006.

[ii] I would like to thank Barry Williams and his excellent Database Answers website http://www.databaseanswers.org/data_models/ for providing many of the table name examples.

[iii] David C. Hay, Data Model Patterns, A Metadata Map, 2006.

[iv]  The distinction between “produced” and “provided” is made to distinguish between, for example, manufacturing and retailing.

Identifying Things (“What”)

May 4, 2017

This is the second post in a series of posts about how to identify entities in data sources that can readily be classified as belonging to each of the 6BI Business Object Categories (BOCs): Parties, Things, Activities, Events, Locations and Motivators.  The first post in the series (on Parties, the “Who” aspect) can be found at   https://birkdalecomputing.com/2017/04/26/identifying-parties/ ‎.

The Things BOC identifies What the concepts and objects are that are produced and consumed by parties.  Data element and data element collection names you may encounter that belong to the Things BOC include but are not limited to names in the following table[i].  The list gives you a hint of what kind of names to look for in putting together a 6BI Analytic Schema for enabling your data to answer business questions.

For the purposes of 6BI the first decomposition of Things is between Product and Payment.  Products are also further decomposed into Good and Service.  Goods are tangible material products for which consumers make payments, and services are products provided primarily by human or human-like labor.  Products are also quite often hierarchical and the names used for each level are Things BOC names in their own right.  These names can be logical such as Class, Category, and Type for example. Or can be physical such as Assembly, Component, and Container.  Look for these words, or ones like them, in conjunction with other words that more clearly designate them as classification levels of a product, such as Asset_Type or Vehicle_Assembly.  Products and Payments represent what is exchanged in a transaction and are differentiated by the direction in which they flow.  Products flow from provider to consumer, and Payments flow from consumer to provider.  Quite often the difference between a Product and a Payment is obvious, but sometimes it’s not.  This is especially true when transactions are “in kind” and it is not obvious which, if either thing, represents the “money”.  One rule of thumb is to always remember who the “first party”[ii] in your analysis and which side of their ledger you are analyzing.  The first party is for “whom” the analysis is done or “who” the analysis is intended to benefit.  If you are analyzing their receivables side then the inflow is always a payment and the outflow a product.  If you are analyzing their payables side then the opposite is true, inflows are product types and outflows are payment types.

Potentially the Things BOC can be identified by more data store names than any other BOC because we as humans often designate all phenomena as things.  In information systems however it is always more useful to refer to the instances of the Things BOC as products or payments.  We use the term “Things” for this category of business objects so that we remember to look at both sides of “what” is being exchanged in a transaction, and not be content to only consider the product alone.  There are simply so many things in the real world but we must concentrate on “how” (see the Activities BOC post) they flow if we need to measure their value to a party and assess a party’s contribution to that value.

A Definition can also be a product. This is true when used to represent the meaning of that which parties (individuals and organizations) produce or consume.  It doesn’t matter what is defined.  It can be a party, a location, an activity, an event, a motivator or anything.  If the definition itself is manipulated (i.e. produced or consumed by a party) then it is a product, and thus a thing.  We can speak about the “Definition of the customer” for example.  Customer is clearly a member of the Parties BOC when it comes to analyzing data content for understanding performance for example.  But the definition itself (i.e. What a customer is) is a product of a metadata system.  If you need to analyze, normalize and rationalize the consistency of various definitions of customer you need to treat these definitions as things and not as parties.  That is, they are products of the system associated with a provider and a consumer.

The customer can have multiple definitions, but each separate definition must be associated with the customer through some unique combination of location, event, activity and/or motivator.  Those for whom the consistency checking and improving is performed are the parties. However, and this is critical, the definition of what a customer is, so that it can be used consistently to mean the same role played by a party depending on some unique combination of activity, location, event, product, and motivator is itself a product.  As a product, its quality can be controlled and monitored, its accuracy and integrity assessed and its use measured.

[i]  I would like to thank Barry Williams and his excellent Database Answers website http://www.databaseanswers.org/data_models/ for providing many of the table name examples.

[ii] The party from whose perspective the measurements are taken.


Identifying Parties (“Who”)

April 26, 2017

This is the first of a series about how to identify entities in data sources that can be readily classified as belonging to each of the 6BI Business Object Categories (BOCs): Parties, Things, Activities, Events, Locations and Motivators. I will start with Parties.

The Parties BOC (Business Object Category) identifies Who produces or consumes objects and concepts.  Examples of commonly used data element[i] and data element collection[ii] names you may encounter in diverse types of data stores, that can be categorized under the Parties BOC, include but are not limited to those in the table below.[iii] They contain names commonly used to identify entities (e.g. tables in an RDBMS and documents in a DDBMS) and attributes (e.g. columns in tables and fields in documents). The list gives you a hint of what kind of names to look for in putting together a 6BI Analytic Schema for enabling your data to answer business questions.

Telling providers from consumers is important to recognize because it will tell you in which direction the product flows and in which direction the payment flows.  Knowing this provides the basis for profitability and resource use efficiencies. Producing parties include such names as Producer, Provider, Seller, Supplier, Broker, Vendor for example. Examples of consuming party names include Consumer, Payer, Receiver, Buyer, Client, Customer.  A Parties BOC name can also identify third parties such as Obligee, Specialist and Agency.  Parties can be animate (Citizen, Patient) or inanimate (Bureau, Department). They can be collective (Organization) or singular (Person). These are some of the names you should look out for in analyzing source data systems. They can be names of data element collections (e.g. tables) and/or names of data elements (e.g. columns). Generally, they hold data about the object types within the Parties BOC which can then be used in answering the Who interrogative component of any query.  Parties often come in pairs, the parties that produce or provide, and the parties that consume or pay. Thus, it is important that when you discover one or more Parties BOC entity in your source data that you ask the question, “Is this a producer or a consumer”?  Of course, a single entity can be both a producer and a consumer depending primarily on the type of thing being measured and the type of activity that causes it to need to be measured. If a “first-party” (i.e. the party from whose perspective the measurements are taken) pays money in the transaction it will be the “consumer” in the scope of the transaction being analyzed. Otherwise the party is the “producer” in some manner and its performance will be measured by some assessment of relative value between product outflow and money inflow. Quite often both providers and consumers will be assessed in some manner, usually by an Assessor, as a result of the measurements.

With the advent of the Internet of Things (IoT) the Role that a device plays in producing and consuming data now means that the Parties BOC includes non-traditionally human parties as well. As a matter of fact entities that previously were only considered as part of the Things BOC can now be parties. The concept of a party has gone beyond the traditional definitions of people and organizations but it still, at the end of the day, remains the producer and consumer of data.

[i] Wikipedia defines any unit of data defined for processing as a data element. Since 6BI deals with the meaning of data elements it is generally non-productive to consider any unit smaller than an attribute or field.

[ii] A data element collection is a set of related attributes or fields. Depending on the degree of normalization they are usually co-located in a container called a table or a document.

[iii] I would like to thank Barry Williams and his excellent Database Answers website http://www.databaseanswers.org/data_models/ for providing many of the table name examples.

The 6BI Analytic Schema

April 10, 2017

6BI (Six Basic Interrogatives) was originally an adaptation of the Zachman Framework[i] to the design of data warehouse data stores.  The idea was based on the assumption that a large number of the business questions that always seem to need answering, regardless of industry, are based on Zachman’s primitive interrogatives. One combination or another of these interrogatives: Who, What, Where, When, How and Why always seems to be needed in order to get the answers we are after in business intelligence.  These combinations consist of at least three of the interrogatives, two of which are always Who and What.  At least one, or as often as not, all four of the other interrogatives are needed to complete what we call the Analytic Schema.  An Analytic Schema is not deigned to answer specific queries but instead is structured to represent all the basic aspects of an enterprise so that queries do not need to be known in any great detail in advance.

Each interrogative is associated with an aspect of the enterprise.  In 6BI, aspects are called Business Object Categories (BOC) and they include Parties, Things, Locations, Events, Activities and Motivators.  Many books and articles have been written explaining and expanding the fundamental concept of enterprise aspects, including those by David Hay[ii], Dan Tasker[iii], as well as Zachman himself and others.  Also, see earlier posts and pages on this blog[iv].

The most effective, and recognizable, form of Analytic Schema is a star schema. Each dimension is classified by one and only one BOC, in other words the aspects determine the type of each dimension.  This classification of dimensions into BOCs already begins to tell us the role each aspect will play in queries built from the schema.  Each BOC is represented by at least one dimension.  The number of actual dimensions classified under each BOC does not matter but it is important to know type of each dimension.  All the dimensions of all types link to the same set of facts.  Figure 1 shows what a 6BI Analytic Schema looks like.

Figure 1. The 6BI Analytic Schema.

The Analytic Schema is a conceptual schema and real world star schemas quite often do not explicitly represent the conceptual nature of 6BI but are physical schemas designed to support a set of queries addressing specific business requirements.  However, it is not generally too difficult to parse and sort the attributes of star schema dimensions into the six categories needed for 6BI.  Difficulties occur with dimension attributes that tend to defy categorization.  For example, is a certain attribute a component of the When or the How interrogative?  This is especially true when we consider the real world information trade-offs that are often needed between events and activities for effective decision making.  Does the event drive the activity or does the activity drive the event?  Something more just correlation is often needed.  Also what about the motivators?

In 6BI Parties and Things have no direct dependency on each other and have no non-intermediated association with each other.  From a data modeling perspective, this means that a Party does not reference (i.e. has no foreign key to) a Thing, and a Thing does not reference (i.e. has no foreign key to) a Party.  This is very important, mainly because of the implicit role of the Who interrogative.  It is “the Who”[v] of the Analytic Schema for which answers need to be found.  Parties are responsible for the results using Things, but those results only have value if placed in a framework of Locations, Events, Activities and Motivators.  In the semantics of queries built on the Analytic Schema the subject is most often one or more Parties and the object (either direct or indirect) is always one or more Things.  Predicates are composed of the other BOCs and the Facts.  6BI Analytic Schemas can be a framework for creating  queries that are a type of logical proposition called a Quadruple because they are always composed of four parts:  subject,  direct object,  indirect object and predicate.

6BI was originally used to do “logical reverse engineering” of existing operational OLTP databases to sort tables into a set of buckets with each bucket representing one of the BOCs.  The thinking was that underneath all the differences that make each organization and its data unique there is a common logical structure upon which an analyst can start the analysis of the problem space.  This can be a great benefit if one needs to “hit the ground running” so to speak.  My experience (25 years and counting) has shown this to be the case.  This was useful when my goal was to identify candidate tables in data sources to frame out the Analytic Schema.  Knowing which tables belonged to which BOC was always helpful because it allowed me to see what role the records in this type of table might play in query development.  For example, I would know that tables classified as BOC Location tables were the most likely to have information about where customers and products were located, and where transactions occurred.  It also identifies the “where” dimension of the facts to use for doing such things as calculating the relationship between location and time in, for example, analyzing the optimum combination of store location and store hours.

This “logical reverse engineering” can not only be applied to tables in a relational database (RDBMS), but to documents in a document database (DDBMS), key-value pairs in a key-value store, and two-level maps in a column-family database as well.

Next, we will look at how to align random data structures (tables and documents) with the BOCs of the 6BI Analytic Schema.


[i]https://www.zachman.com/about-the-zachman-framework

[ii]https://www.amazon.com/Data-Model-Patterns-David-Hay/dp/0932633749

[iii]http://www.gettextbooks.com/isbn/9780646125244/

[iv]https://waynekurtz.wordpress.com/

[v]Not the British rock band.

6BI and Aggregate-Orientation, Part 2

September 15, 2016

This is the second part of a two-part post. The first part can be found at https://waynekurtz.wordpress.com/2016/09/06/introduction-to-6bi-and-aggregate-orientation/.

To transform a 6BI (“Six Basic Interrogatives”) derived logical data model into an aggregate-oriented data model there are several steps that need to be taken. We will use the logical business data model shown in Figure 3 as our example to show this transformation. It’s very simplified but fairly typical of certain types for commercial enterprises.

ldm-clean-9-9-2016-2-36-43-pm

Figure 3. A Business Data Model Example.

Semantically we can say the following about our business data model. A Customer can have many Contacts, and a Contact can have many Customers. The Customer_Contact entity[i] resolves this by linking a Customer to its Contacts through the “has contact” relationship and a Contact to its Customers through the “has customer” relationship. A Customer “places” Orders, “receives” Order_Invoices, and “makes” Order_Payments. A Provider “receives” Orders. An Order “contains” Order_Items and a Product “identifies” Order_Items. An Order_Invoice “is paid for by” Order_Payments and a Payment “is applied to” an Order_Payment.

Unlike data modeling where the outcome, as mentioned in Part 1, is typically the creation of tables which separately store instances of entity types linked together by key-based references, the outcome of an aggregate-oriented data model is the creation of aggregates. An aggregate is a complex data structure based on a “root entity”. The root is determined by the business requirements and is identified as an entity type in an LDM. This entity is often derived from a 6BI BOC (“Business Object Category”). Aggregates are stored as a nested collection of entity instances whose relationship to the root is also determined by business requirements. How deeply an entity type is nested within the aggregate structure is determined by where it is placed along a dependency gradient.

Dependency Gradients

A dependency gradient is a continuum of degrees of dependency where the amount of dependency flows from a higher concentration to a lower concentration. It flows from entities that have a greater number of dependencies, both direct and indirect, to entities with a lesser number of dependencies. An entity that consumes no other entity’s identifier (i.e. it has no foreign keys) is referred to as the “apex entity” of the continuum and has the least dependency. An entity whose identifier is not consumed by any other entity along the continuum is referred to as the “base entity”. The relationship between a base entity and an apex entity could be direct, however there are often many potential intermediate entities between the base and the apex entities.

Figure 4 shows two dependency gradients that flow from the same Base Entity Order_Payment (a type of Exchange).

  • Dependency Gradient-01 flows through the relationship “is applied to” directly to Apex Entity-01 Payment (a type of Thing).
  • Dependency Gradient-02 flows through the relationships “is paid for by” to Order_Invoice (a type of Exchange), “is billed thru” to Order (a type of Exchange), and finally “places” indirectly to Apex Entity-02 Customer (a type of Party).

dep-grad-9-13-2016-14-40-20-am

Figure 4. Dependency gradients flowing from Order_Payment.

Dependency gradients form dependency trees when the flow from base to apex takes more than one path. The term gradient[ii] is used to indicate the relative degree and direction of dependency along a tree. Dependency always flows from a higher concentration (more foreign keys) to a lower concentration. Aggregates in an aggregate-oriented data model are based on dependency trees.

Steps for Transforming the LDM

The following ordered set of steps are required for transforming a LDM into an aggregate-oriented data model.

  • Select the root entity for each aggregate.
  • Identify relationships to be eliminated by “rolling down” parent entity attributes into the child entity.
  • Identify relationships to be collapsed by “rolling up” child entity attributes into the parent entity.
  • Eliminate unneeded apex entities by rolling down their attributes to an entity higher on the dependency gradient.
  • Roll up attributes from base entities in the direction of the root entity along selected dependency gradients.
  • Create the aggregate-oriented data model.

Select the Root Entity for each Aggregate

The root entity of an aggregate, identified by the ROOT operator, can occur anywhere along the dependency gradient and is independent of the relational association (i.e. relationship) between itself and any other entity along the gradient. The other entities in a dependency tree, called aggregate participants, are embedded into the aggregate root entity instance. The embedding of participant entity attributes into the aggregate root occurs regardless of whether the participant is in the direction of the apex or in the direction of the base relative to the root. Identification of the root entity will influence which relationships get eliminated and to a greater extent determine which relationships get collapsed.

Identify Relationships to be Eliminated

Relationships to be eliminated are tagged with the REFI[iii] tag. To identify each individual action triggered by the REFI tag the tags are numbered starting with REFI-01. In eliminated relationships the parent entity is removed and all or some of its attributes are rolled down into the child entity.

Which attributes to roll down is determined by how normalized the entity is. In cases where an entity has attributes that are not part of one of the dependency gradients being aggregated the non-dependent attributes would not be rolled down, however the relationship is still eliminated in transforming the logical data model into aggregate-orientated data model.

Figure 5 shows the relationship between Product and Order Item named “identifies” tagged as REFI-03. In this case it was decided this relationship would be eliminated and the parent (Product) attributes were rolled down into the child (Order Item) entity eliminating the relationship and its parent entity.

refi03-9-10-2016-1-00-40-pm

Figure 5. A relationship tagged for elimination.

Identify Relationships to be Collapsed

This step requires modelers to take an entity, like Order in our example data model, which has other entities that refer to it and roll up the attributes of its selected child entities into the parent entity. Order and its dependent entities, Order_Item through the “contains” relationship, and Order_Invoice through the “is billed thru” relationship are shown in Figure 6. Only the relationship with Order_Item is tagged as EMBED-02. The relationship with Order_Invoice does not need to be tagged for this transformation because Order_Invoice has a separate relationship with Customer named “receives” and its attributes are rolled up along that dependency gradient (see Figure 7).

ldm-embed-tag-9-10-2016-1-38-40-pm

Figure 6. A relationship tagged for collapse.

Figure 7 shows the whole example model tagged in preparation for transforming it into an aggregate-oriented data model with Customer as its root entity.

ldm-tagged-9-10-2016-1-17-36-pm

Figure 7. A logical data model tagged for transformation.

Eliminate Unneeded Apex Entities

Figure 8 shows what the physical data model (PDM) looks like after certain relationships, and their parent entities, are eliminated. In this model we have eliminated the relationship “has customer” rolling Contact into Customer_Contact (REFI-01), “receives” rolling Provider into Order (REFI-02), and “identifies” rolling Product into Order_Item (REFI-03)[iv]. Please note that in the roll downs we have included the parent primary keys (now as non-key attributes). Strictly speaking we would not always need to do this. If we were to implement this data model in a relational database management system (RDBMS) the entity Provider would become a table and its attributes columns.

Again this is actually more of a business decision than strictly a technical decision, though I suspect it is rarely considered so. This is another reason why I say selection of a NOSQL database is at least as much of a business decision as a technical decision.

pdm-rel-9-9-2016-2-40-24-pm

Figure 8. Our example data model after eliminating unneeded apex entities.

Create the Aggregate-Oriented Data Model

Figure 9[v] shows an aggregate-oriented data model based on Customer as its root entity. All the attributes of the entities that survive the roll down are rolled up along dependency gradients and collapsed into the Customer_Aggregate forming the nested collection of entity instances, which is called an aggregate.

We have the same issue here that we had in the previous section. What do we do with the entity identifiers (i.e. primary keys)? One identifier that we have to keep of course is the primary key of the root entity, Customer_Aggregate.customer_id. It is the identifier of the aggregate. The answer for an aggregate is not the same as the answer for a table. In a RDBMS we are optimizing the design of tables, in a NOSQL database we do not have tables. All the attributes of all entity types included in creation of the aggregate are considered attributes of the aggregate and no longer “stand alone” entities or entity instances. The identifiers of all aggregate participants are removed from the model.

cust-agg-9-13-2016-3-23-47-pm

Figure 9. Aggregate-oriented data model.

Not having tables as your “modeling target artifacts” may be a difficult and even disturbing concept for data modelers experienced in identifying and normalizing entities. For this reason an aggregate-oriented data model is a new type of data model. It is not a logical model, but it is also not a physical model in the strict sense that it can be used to generate pre-defined database schema structures (e.g. tables). It is used to relate the entity types and relationships designed in a logical data model, and the business requirements they represent, to the chosen type of NOSQL database (e.g. key-value, column family, document, and others) and the unique metadata structures each type of NOSQL database has.

A final transformation is required to create code for the construction of the appropriate aggregate-oriented NOSQL database structures. Because we typically see NOSQL data structures expressed as a mixed meta-data and data structure such as a JSON string it is easy to forget that JSON still has a schema. That schema is often maintained in the application code and not in the database engine. The advantage of this is more flexibility in application development but the cost is often a lack of the uniform constraints needed to maintain the re-useable data structures required for non-deterministic query construction and compliance to data governance standards.

In summary the steps needed to transform a LDM into an aggregate-oriented data model are the following. First, identify the root entity for the aggregate in the LDM, identify non-root parent entities to be eliminated by rolling down their attributes into their child entities, and finally identify child entities to be collapsed by rolling up their attributes into the root entity along dependency gradients that have the aggregate root as apex entity.

In a future paper I will describe how the concepts in this article can be applied to data targeted to be stored in popular NOSQL databases.

[i] It’s conventional for data modeling tools to call the rectangles in LDMs “entities”. They can also be called “types” or “entity types”. The physical form should be called an “entity instance”. In this paper I will use “entity” and “entity type” interchangeably because most of the paper deals with logical data modeling and most of the tools used for logical data modeling call them tables. Where I refer to physical modeling I use either “entity instance” of if entity is understood just “instance”.

[ii] In physics “gradient” is defined as an increase or decrease in the magnitude of a property, the change of which can usually be measured. The word seemed appropriate to name the concept of increasing or decreasing dependency.

[iii] The REFI and EMBED tags were identified by Jovanovic and Benson. Their usage in this article is derived from the paper but may differ slightly from the original meaning, including the numbering of each instance of a tag type for easier identification of each individual roll-up and roll-down action.

[iv] It is important to understand that the three eliminated entities are not removed from the data model, neither logically or physically. They are simply not part of the aggregate-oriented data model.

[v] Any reader familiar with the Erwin Data Modeler tool will recognize that I’ve used the symbol for a View to represent the aggregate. This is not to say that an aggregate is the same as a view. Erwin, nor any other data modeling tool I am familiar with yet supports aggregate oriented modeling. The COMN data modeling technique introduced by Theodore Hills is the closest I’ve seen to actually recognizing and describing a methodology for doing so. Please see http://www.tewdur.com .

Introduction to 6BI and Aggregate-Orientation

September 6, 2016

I wrote this article after reading NoSQL Distilled, A Brief Guide to the Emerging World of Polyglot Persistence by Pramod J. Sadalage and Martin Fowler in the summer of 2016. I was incented to read the book after seeing Martin Fowler give a presentation on NoSQL at a 2013 GoTo Conference presentation, which can be viewed at https://www.youtube.com/watch?v=ASiU89Gl0F0.

Up to that point the whole concept of “NoSQL” was very fuzzy to me, but after experiencing his presentation and reading the book I realized that the “lynchpin” that held RDBMS and NoSQL together was a concept that many SQL database architects have been working with for years, the common de-normalized data structure. One problem (among several) with de-normalization has always been how do you systematically de-normalize data so that two de-normalized data-sets can be compared to each other in a consistent and repeatable manner to assure reliable analysis by different parties, over time and in different locations.  In other words how do we maintain the old “apples-to-apples” and “oranges-to-orange” paradigm.

————————————————————————————————————

Six Basic Interrogatives, or 6BI for short, provides an approach for organizing and understanding the context of data used to support business decision making.  I first wrote about 6BI back in the 2004-2005 time frame when I was working full time as a Business Intelligence Data Architect and needed a quick way to get started analyzing existing data in order to organize it to answer business questions.  Since that time I’ve had other opportunities to put 6BI to use in situations not normally identified as business intelligence, certainly not the traditional type which focuses on a central RDBMS based data warehouse.  I have found it holds up well, as I thought it would, in various scenarios and has versatility and applicability in just about all the computing situations that I have found myself in.

With the increased popularity of distributed computing, fueled mostly by the overwhelming up take of mobile devices both for business as well as personal use, new highly scalable technologies for persisting data have been developed.  These technologies tend to rely more on an expanding network of smaller computing units as they grow by scaling out to more units, as opposed to a small number of large and ever growing computing units which grow capacity by scaling up.  Scaling out is most often referred to as “horizontal scaling” while scaling up is referred to as “vertical scaling”.  There is no doubt that horizontal scaling is more popular today than vertical scaling.  Going hand-in-hand with the horizontal scaling trend has been the introduction of alternative data stores now collectively known as NOSQL databases.

Three types of NOSQL databases that are designed to store a rich structure of closely related data that is accessed as a unit were identified by (Sadalage and Fowler 2013)[i].  They call this type of database an aggregate-oriented database because its basic storage structure is conceptualized differently from that of a traditional relational database management system (RDBMS).  An RDBMS stores its data in tables, or more precisely in relations.  Relations allow data to be normalized into units (tables) which contain data that is dependent only upon the primary key of the entity.  From a logical perspective we can say that each set of attributes (i.e. a row in a table) describes one and only one instance of an entity which in turn is differentiated from all other instances of all other entities by its unique identifier. The columns of the table store the attribute values of the entity instance where its row intersects with its columns.

In practice this results quite often in data about customers stored in a Customer table, data about products in a Product table, data about Orders in an Order table, and so forth.  This is a very powerful design because it does not pre-suppose any fixed relationship between Customers, Products and Orders, but it let’s designers and developers link them together in any way that meets business requirements even when these requirements might not necessarily be known in advance.  This ad hoc linking is made possible by the SQL language[ii].

NOSQL databases, in order to provide more performance across distributed data stores, even when the nodes are distributed globally, were conceptualized and built with a different set of priorities.  Non-deterministic query structure was not a priority, but instead just capturing and persisting the data as quickly as possible was the top priority.  There was no need to build SQL language interpreters into the architecture of these “new age” data stores.  As a result NOSQL databases end up sacrificing some of the flexibility needed to support non-deterministic query construction in favor of higher performance access in a distributed landscape, or cluster.

Inevitably this trade-off has lead to the need for designers to know or predict, in advance, how the data will be accessed, which entities will need to be joined, and in what order to answer their business questions.  The loss of the luxury of not needing to know in advance exactly how your data will be accessed is the price that is paid for better performance.  Fair enough!  Nothing comes without its cost, especially in the world of computing. The important thing to remember is that there will always be a trade off[iii].

There are three aggregate-oriented NOSQL database categories that have emerged over the last several years:  Key-Value, Document, and Column Family.  Each is different but they share a conceptually similar data storage unit called an aggregate[iv].  A data modeler (or developer modeling an application’s data) using these new types of models needs to start thinking about how the data will be accessed earlier in the design and development process than ever before.  As (Sadalage and Fowler 2013) state, aggregate awareness needs to be made part of the design of the data model[v].  I can see how this could be the case when there is a lack of clarity between the role of database design and that of database development.  With the advent of aggregates and aggregate-orientation the job of a business intelligence data modeler has changed from being able to concentrate on business requirements to needing to be more aware of how the data will be accessed and stored.  This challenge is stated succinctly by (Jovanovic and Benson 2013) when they say NoSQL databases have opened a new non-trivial problem area for data modelers[vi].

If we do the aggregate data modeling at a level independent of the style of the data store (i.e. Key Value, Document or Column Family) however we can create implementation neutral and re-useable data models that reflect the requirements of the business as much as they reflect the requirements of the technology used to implement it.  Data organized with an aggregate-orientation needs to be modeled at a logical level just as much as data organized with a relational orientation ever did.  In both cases we need to start with the basic entities that describe business value for persisting and manipulating data.  The need for an organizing framework for data still exists.  We still need to know which real world entities (regardless of how they are instantiated in the data store) the business cares about and how these entities relate to each other.

Business Object Categories

6BI is built on a framework of six universal and re-usable Business Object Categories (BOCs).  Each BOC represents a non-overlapping category of business data.  Each category corresponds to one of the six basic interrogatives: Who, What, Where, When, How and Why.  Figure 1 shows the six basic interrogatives and the business object category which is derived from each including example sub-categories which will be used in subsequent business data model examples.

Basic Interrogative Business Object Category
Who produces the data used to measure performance? Parties[vii] (e.g. Customer and Provider)
What is being manipulated or exchanged to produce measurable performance? Things[viii] (e.g. Product and Payment)
How are the data values that measure performance produced? Activities (e.g. Exchange and Process)
When does the activity take place or for how long is the performance measured? Events (e.g. Point in Time and Period of Time)
Where does the activity used to measure performance take place? Locations (e.g. Address and Placement)
Why does the data actually measure performance? Motivators[ix] (e.g. End and Means

Figure 1. Six Basic Interrogatives and Business Object Categories.

In the 6BI Framework, Parties and Things have no direct association with each other.  It is only through the other four Business Object Categories (Activities, Events, Locations, and Motivators) that Parties and Things are associated.  The left side of Figure 2 shows the relationship of Parties to Activities, Events, Locations and Motivators.  The right side shows the relationship of Things to the same four BOCs.  This makes sense because only when parties engage in activities, exchanging and manipulating things between them, do events get generated at certain locations and reasons why become relevant.  Figure 2 illustrates the relationships between business object categories, both direct and indirect.

6bi-party-product-assocs-20160826

Figure 2. The indirect association of Parties to Things.

These business object categories provide the framework and starting point for classifying data that are need for non-deterministic query structure.  This design allows enough flexibility to support ad hoc reporting by focusing on the basic questions that all decision support data structures need to support, while not requiring a strictly relational storage structure underneath.

In the next part of this article we will show a method for transforming a 6BI derived logical data model into an aggregate-oriented data model.


[i] Pramod J. Saladage and Martin Fowler, NOSQL Distilled, A Brief Guide to the Emerging World of Polyglot Persistence, Addison-Wesley, 2013. Sadalage and Fowler identify four (4) types of NOSQL databases. The fourth being Graph databases which we will not be discussing in this article.

[ii] SQL is not the first relational database language.  In the 1980s each relational database product had its own language, each of which did pretty much the same thing.  SQL simply won the “database language war”.  It is often criticized for being, among other short comings, “less than perfect”. But like the human communication vehicles known as “natural languages” it too has evolved to fit its purpose and become widely accepted as a result.

[iii] This is the reason why the choice of using a NOSQL style database is, or should be, as much a business decision as a technical decision.  What needs to always be taken into consideration are the possible hidden costs of implementing a database solution that does not support SQL. Especially in light of the fact that SQL has become a virtual “lingua franca” of data analysis and business intelligence. These costs may be hidden from the group making the NOSQL database decision since it is quite likely they are not the  same group that uses SQL to answer business questions.

[iv] Sadalage and Fowler, page.13.

[v] Sadalage and Fowler, page.17.

[vi] Vladan Jovanovic and Steven Benson, Aggregate Data Modeling Style, Proceedings of the Southern Association for Information Systems Conference, Savannah, GA, USA March 8th–9th, 2013, page 75.

[vii] Parties are often first specialized into “Persons” and “Organizations” but whether a party is only one or a group is not relevant to our discussion here.  Instead I used a sub-categorization that is more reflective of the role that a party plays in an exchange.

[viii] In earlier articles on 6BI the term “Product” as the name of the 1st level BOC that corresponds with the “what” interrogative was used. Product however is not universal enough.  For lack of a better term I use “Thing” to include Money along with Goods and Services.

[ix] In earlier articles on 6BI the terms “Plans” and “Rules” were used as BOCs that correspond with the “why” interrogative. But these are only Means, not Ends, and “Why” needs to include both Ends and Means.

The Data Architecture of Business Plans Part 2 – Key Performance Indicators

November 9, 2013

In the first part of this article about the data architecture of business plans https://waynekurtz.wordpress.com/2013/09/28/the-data-architecture-of-business-plans-part-1-an-overview/, we discussed an industry standard meta-model for modeling business motivation[i].  We started with the four core elements of business plans: End, Means, Influencer, and Assessment.  We identified Desired Result as the type of End that an enterprise intends to maintain, and Goal and Objective as two types of Desired Result.  We also included Measurement as an expression of an Objective. On the Means side we identified Course of Action which represents the approach or plan for configuring some aspect of the enterprise, Strategy as the essential Course of Action for carrying out the enterprise’s plan, and Tactic as the means to implement the Strategy.

An Assessment, we’ve seen, is a judgment about the impact of Influencers on the enterprise’s Desired Results and Courses of Action[ii].  Assessment Elements are the components of an Assessment that link it to individual Desired Results and Courses of Action.  The net effect of an Assessment Element is the identification of a measured Potential Impact[iii].

A Key Performance Indicator (KPI) is a type of Assessment that is a judgment about the impact of the difference between two measurements, the Target Expression, associated with a Desired Result and the Result Expression, associated with a Course of Action.

Desired Results

Figure 10 illustrates the relationship between a Desired Result and a Key Performance Indicator.  A Key Performance Indicator has exactly one Target Expression which is based on one and only one Objective which quantifies one and only one Goal.  As we’ve already observed, both Goal and Objective are types of Desired Result.  If the Desired Result is a Goal it may be quantified by one or more Objectives.  Each Objective may be the basis of one or more Target Expressions.  Each Target Expression is a part of one and only one KPI.

Figure 10.  Desired Results and Target Expressions.

2.1-10 Desired Results & KPIs

However, not all Goals are stated in a way that makes them easily quantifiable by an Objective.  When a Goal cannot be quantified by a set of Objectives one of two things is bound to happen.  Either the Goal becomes more or less irrelevant to the operation, productivity or culture of the enterprise and thus its significance is eventually deprecated, or Objectives that quantify it are eventually defined, vetted and socialized.  There is a thin line between Goals and Objectives, as we’ve seen they are really just two types of the same thing, Desired Results.  The difference between them is driven by the fact that we need a way to differentiate between Desired Results that can be measured and those that cannot.  For purposes of performance management we ignore those that cannot be measured.

Courses of Action and Result Expressions

Figure 11 illustrates the relationship between a Course of Action and a Key Performance Indicator.  A Key Performance Indicator has exactly one Result Expression which is based on one and only one Actual Result which is produced by one and only one Business Process which may employ one or more Efforts.  Each Effort is invoked by one and only one Course of Action.  However, a Course of Action may be invoked via one or more Efforts, each of which is used by one and only one Business Process.  Each Business Process may produce one or more Actual Results, each  which may be the basis of one or more Result Expressions. A Result Expression is a part of one and only one KPI.

Figure 11.  Courses of Action and Result Expressions.

2.1-11 Courses of Action & KPIs

It is assumed that the Potential Impact of a KPI can be judged, usually in discrete intervals, along a continuum from very positive or very negative.  What constitutes positive or negative for any KPI is determined by the requirements of the business and is subject to change over time.  This fact is why configuration management of KPIs is important. Without configuration management, the ability to compare not just KPI status and trend values from period to period, but the evolution of the method by which they were calculated can be tracked.  This becomes more important as organizations begin to not only use KPIs to do assessments and influence behavior, but also to judge the effectiveness of the KPIs themselves, their relevance to changing business patterns and their effectiveness in bringing attention to areas that need it.  In this article however we are primarily interested in the design and construction of KPIs and not as much in how they potentially impact and are impacted by various influencers.

The Role of Effort

Figure 12 illustrates the central role that Effort plays in the meta-model of the data architecture of business plans.  A Course of Action, as we saw in Figure 11, may be invoked via one or more Efforts.  The figure also shows that a Desired Result may be supported via one or more Efforts. It shows that a Business Process may employ one or more Efforts.   Finally, a Party, which is either a Person or an Organization, may be a player of one or more Party Roles, one of which then may perform one or more Efforts.

From the perspective of an Effort it is invoked by one and only one Course of Action, in order to achieve one and only one Desired Result.  It is also used by one and only one Business Process while it is performed by one and only one Party Role.

Figure 12. The central role of Effort in the business plans meta-model.

2.1-12 Central Role of Effort

As stated earlier an Influencer is anything that can produce an effect on the enterprise without apparent exertion of tangible force or direct exercise of command[iv].  As depicted in Figure 13 we see that an Effort may be assessed by one or more Key Performance Indicators in the same way that an Influencer may be assessed by one or more Assessments. Correspondingly, a KPI assesses one and only one Effort, as an Assessment of which it is a subtype, assesses one and only one Influencer.

Figure 13. Key Performance Indicators and Influencers.

2.1-13 KPI & Influencers

Key Performance Indicators

There are many different perspectives from which an organization’s performance can be viewed.  There are also many different aspects in which each perspective on performance can be viewed.  One aspect is that of motivation, or “why” has the performance turned out as it has and how can the organization improve its performance.  At each perspective of the Motivation aspect[v] “why” type questions need to be answered.  Answers to these questions are aided greatly by the assessments of the measurements that indicate the performance of the organization.  These indicators are called performance indicators, and most organizations have a large number of them.  Many of these are recorded because they “always have been” and others simply because they are relatively easy to produce.  In order to provide decision makers with just the right set of performance indicators at the right time, the concept of the Key Performance Indicator (KPI) was developed.  A KPI is not only an indicator of some aspect of performance but it is critical to improving that aspect of performance.  It is also “key” because it can be clearly associated with a perspective of the enterprise.  For example, there are KPIs that assess performance at the Planner perspective, at the Owner perspective, at the Designer or Architect perspective, at the Builder perspective, at the Subcontractor perspective, and even at the Functioning Enterprise perspective[vi].  The higher the perspective is in the enterprise architecture, the more strategic its assessments tend to be.

There are many business performance oriented books and articles that describe techniques for determining which performance indicators are Key Performance Indicators, and a study of how to select the best KPIs is beyond the scope of this article.  Suffice it to say that the process is very specific to both the organization and its industry.  There can be almost an unlimited number of performance indicators in any good sized enterprise.  Not all performance indicators are of equal importance when it comes to assessing the performance of an enterprise.  A performance indicator is said to be “key”, and thus a Key Performance Indicator when it can be demonstrated through measurements, that it is an indicator of the enterprise’s ability to accomplish its goals and objectives through the carrying out of its mission by strategic, tactical and operational means.

In this article we are interested in the data architecture of KPIs.  Figure 14 illustrates the structure of a Key Performance Indicator. Since KPIs are Assessments of Effort and an Effort may be composed of other Efforts, a Key Performance Indicator may also be composed of other Key Performance Indicators.

Figure 14. The Key Performance Indicator meta-model.

2.1-14 KPI Metamodel-A

In the meta-model of the business plans data architecture a Key Performance Indicator always has one each of three (3) expression elements.  These are:

  • Target Expression (aka Target) which is part of one and only one KPI and is based on one and only one Objective.  An Objective may be the basis of more than one Target Expressions however, and thus may be used in more than one KPI.
  • Result Expression (aka Result) which is part of one and only one KPI and is based on one and only one Actual Result.  An Actual Result may be the basis of more than one Result Expressions however, and thus may be used in more than one KPI.
  • Status Expression (aka Score) which is part of one and only one KPI and is used to indicate how the Result Expression compares to the Target Expression.  It uses one  Result Expression and one Target Expression.  Each of which is used in exactly one Status Expression.  It can take the following forms:
    • A Score expressed as a percentage where the Result Expression is divided by the Target Expression, or
    • A Function that returns a normalized value between -1 and 1 where 1 is interpreted as “Result is very good” and -1 is interpreted as “Result is very bad

The Status Expression is often expressed graphically as an indicator using a set of color-coded graphic icons.  For example: red, yellow or green icons to represent the different judgments made by the KPI.  The specific indicator associated with the different states of the Status Expression is determined according to some Scoring Pattern and Banding Method combination, as we shall see shortly.

Figure 14 also shows the other four (4) optional elements of a KPI.  These include:

  • Trend Expression (Trend) which shows the directional change in the Status Expression.  It can either show the change period over period, or be derived by a formula that returns a normalized value between -1 and 1 where 1 is interpreted as “Status is getting a lot better” and -1 is interpreted as “Status is getting a lot worse”.
  • Weight Expression (Weight) which returns the relative weight of the KPI.  If a KPI has a parent KPI you can define the weight to control the contribution of a KPI to its parent. For example, if there are two child KPIs, one weighted at 60% and the other at 40%, the parent KPI would be more influenced by the former than the latter.
  • Time Expression which returns the current time dimension member that is relevant for the KPI.  For example, time can be expressed either as a Point in Time indicating the KPI assesses the performance of an Event, or a duration, the difference between two points in time, to indicate performance assessment over a period of time.
  • Responsible Party who is typically the person or organization responsible for the KPI.  This responsibility can be for maintenance such as changing and updating any of the expression elements of the KPI.  The responsibility can also be accountability for the performance of the enterprise underlying the KPI.  These two responsibilities may or may not belong to the same Party.  If it is the same party then issues of conflict of interest may arise.  Over time, maintenance of KPIs and the Measurements on which they are based is very important.  If KPIs are expected to continue to be relevant and return value to the enterprise they must be adjusted to reflect changing business conditions.

KPI Scoring and Banding

Probably the most common scoring and banding combination for Key Performance Indicators is illustrated by the example in Figures 15 and 16[vii].  This technique is referred to as “Increasing is Better – Actual Values”.   In this method the higher the Score the better, with the Score determined by dividing the actual Result value by the actual Target value and expressing it as a percentage.  Quite often a maximum Score value is set.  Figure 15 illustrates this technique with five (5) component measurements rolled up into one composite measurement.  The composite Score (119.95%) is simply the sum of the component Scores divided by the number of component KPIs (listed under “Measure” in the example below).

Figure 15. An example of an “Increasing is Better – Actual Values” type composite KPI.

2.1-15 Scorecard BAR-02+Comp measure

As illustrated in Figure 16, threshold values are determined for the scoring bands of the KPI (three in this case) labeled “Good”, “Average” and “Poor”.  If the Score is equal to or greater than 100%, it is assessed as “Good” and the Status indicator is a green square, if the Score is less than 100% but equal to or greater than 90% it is assessed as “Average” and the Status indicator is a yellow triangle, and finally if the Score is less than 90% it is assessed as “Poor” and the Status indicator is a red circle. KPIs for which there is no score are shown as white circles.

Trend is calculated by taking the difference between the current period Score and some previous period Score (in this case the previous month).  If the difference is positive, an upward pointing “arrow in a circle” icon is displayed, if the difference is negative the arrow points downward, and if there is no change the circle icon has no arrow.  Each KPI has a name, in this case “Administration” and a description (not shown).  They are grouped into both Program and Strategic Scorecards which can then be incorporated into operational, tactical and strategic dashboards.

Figure 16. An example of a Scorecard with KPI scoring bands.

2.1-16 Scorecard BAR-01

For performance assessment problems requiring more complex calculations, expressions are used instead of raw values when comparing the Result value to the Target value.  This is a technique available in many BI and enterprise performance management (EPM) tools today.  Rather than using the raw Target and Result values to calculate a Score, the results of a Target Expression and a Result Expression are factors in the calculation of a Status Expression.  The two KPIs in Figure 17, though more simple in appearance, are intuitive in design and actually represent more complex calculations than the previous example.

The challenge here is to assess the performance of an institution in reducing criminal assaults cumulatively over a number of years.  The top KPI represents performance for 2006 and the bottom for 2007.  The Desired Result is stated in terms of the number of assaults per population of 1,000, the strategic Goal is to reduce assaults by 5% over a four year period, so the tactical Objective is to decrease the percentage by 1.25% each year.  A Target Expression is used to calculate the Target value (labeled as “Goal”) applying each year’s percentage reduction to the previous year’s Target value thus producing a progressively aggressive Target.

The Actual Result produced by the Business Process is calculated by a Result Expression and expressed as a Result value (labeled “Value”).  For 2006 the Result is 0.9892 and the Target is 0.9875, which is 1.25% less than the Target for 2005.  This performance is assessed as “Average” by the Status Expression and banded with a yellow Status indicator (the middle yellow segment of the dial icon).  The Trend is downward, i.e. there were fewer assaults in 2006 than in 2005, and thus the Trend indicator (the arrow) is pointed downward, and this is better than the previous period (2005) so the Trend indicator arrow is green.  This is an example of a “Decreasing is Better – Actual Values” type of KPI.

In 2007 the Target is decreased to 0.9765 per 1,000 population, making the criteria for the “Good” and “Average” performance bands more stringent to meet.  In the bottom KPI we see that the Actual value is 1.0648 thus pushing the Status indicator into the “Poor” band (the right-hand red segment of the dial icon) and causing the Trend indicator to point upward, because of the increase in Actual value and turn red because of the increase in percentage, calculated by the Result Expression, over the 2006 percentage.

Figure 17. An example of a “Decreasing is Better – Actual Values” type of complex KPI.

2.1-17 Complex KPI together

The Trend icon is an example of the use of one graphic icon to display two measurements.  The direction of the arrow indicates the direction of the Trend, up or down, and the color indicates the judgment of that direction expressed, green for “Good” and red for “Poor”.  This can be confusing if not explained.  Also the use of color alone to indicate a state of performance means that about 10% of the adult population cannot discern its meaning because of color blindness.  The example above is used to illustrate a concept not necessarily to indicate best KPI display practices.

Scoring Patterns and Banding Methods

The Scoring Pattern of a KPI (as seen above) indicates whether it is better to have a Result that is increasing, decreasing, or as close to the Target as possible, without being either higher or lower.  The table below describes the three KPI Scoring Patterns.

Scoring Pattern

Assessment Criteria

Increasing is Better In general, the greater the value of the Result the better.  Usually if the Result is greater than the Target it is considered to be a positive condition.  For example, under most circumstances it is considered better to have increasing revenue.  KPIs assessing revenue topics are generally banded as “Increasing is Better”.
Decreasing is Better In general, the less the value of the Result the better.  Usually if the Result is less than the Target it is considered to be a positive condition.  For example, under most circumstances it is considered better to have decreasing costs.  KPIs assessing cost topics are generally banded as “Decreasing is Better”.
Closer to Target is Better In general, the closer the Result is to the Target the better.  Usually if the Result is exactly the same value as the Target it is considered to be a positive condition.  For example, under most circumstances meeting headcount targets as close as possible in a given period is considered better than either hiring too few people or hiring too many people.

The Banding Method determines if actual values, normalized scale values or some other method is to be used to arrive at the Result value and Target value.  Banding Method however does not determine how many bands are used.  Many KPIs use three scoring bands because it is the simplest way to convey the relationship between a Target Expression and a Result Expression.  The table below describes three KPI Banding Methods.

Banding Methods

Assessment Criteria

Actual Values Banding is done using the quotient of the Actual value divided by the Target value which is referred to as the Score.
Normalized Actual over Target Banding is done using a Function that returns a normalized value between -1 and 1 where 1 is interpreted as “Result is very good” and -1 is interpreted as “Result is very bad”.
Stated Score An advanced technique where stated scores may be systematically substituted for Actual and Target values.

Summary

In this article we have attempted to show a way to extend the data architecture of business plans from the Ends and Means of the Business Motivation Model[viii] all the way to the Key Performance Indicator, a widely used Assessment tool for determining the success or failure of those plans.


[i]  “Business Motivation Model, Version 1.0” published in August 2008 by the Object Management Group (OMG). For more refer to http://www.omg.org/ .

[ii] Influencers can have an impact on other types of Ends such as the enterprise’s Vision, and other types of Means like Mission and Directive as well.

[iii] Hay, Page 187.

[iv] Hay, page 187.

[v] The Zachman Framework for Enterprise Architecture.

[vi] See earlier references to the Perspectives of the Zachman Framework for Enterprise Architecture.

[vii] Courtesy of  the “Boston About Results” program, Boston, MA, USA.

[viii] The Business Motivation Model, Business Governance in a Volatile World, The Business Rules Group, Copyright 2007, The Business Rules Group.

The Data Architecture of Business Plans, Part 1 – An Overview

September 28, 2013

This article was first published August 1, 2010 on The Data Administration Newsletter (TDAN) website but is no longer available there.  It is the first of a two-part series presenting a simple model for capturing the structure of the “why” aspect of the Zachman Framework.


In this article about the data architecture of business plans we will look at a standard meta-model for modeling business motivation.  From an enterprise architecture prospective a business plan is the type of artifact produced at the intersection of the Business Model perspective (row two) and the Motivation aspect (column six) of the Zachman Framework, one of the most widely recognized and referenced frameworks for enterprise architecture [i].  Since models of business motivation are of most importance to business owners, this perspective is also referred to as the Business Owner perspective and the corresponding standard meta-model as the Business Motivation Model[ii].

We will explore how the standard meta-model can be extended to support the data architecture of key performance indicators (KPIs) which are popular assessors of the measurements of business performance.  These measurements are often assessed in reference to the goals and objectives of the enterprise.  KPIs are widely used tools in enterprise performance management (EPM) scorecards, which are in turn ubiquitous components of all three types of performance dashboards:  Strategic, Tactical and Operational[iii].

The Motivation aspect addresses the question of why certain courses of action are chosen or should be chosen, why certain types of persons and organizations are important, why certain products should be more heavily invested in and why corrective actions need to be taken for others, why certain events are important, and why some locations are preferred over others.  We will take a look at the structure of the data that describe the Motivation aspect of the enterprise from the perspective of the Business Owner.  The data we will model in this article describe the entities and relationships of the data content that describes the “real world” motivations of an enterprise and thus we refer to it as metadata and the models used to understand it as meta-models.

From a Six Basic Interrogatives or 6BI[iv] point of view, when we are creating or vetting the design of a software application intended to support decision making, we seek answers to questions that will tell us “why” our client makes or should make certain business decisions and not others and “why” it is worth making the investment necessary to build (or buy) the solution we are proposing and not take another course of action.  These “why” questions are just as important to ask as questions such as “what” information do we need to make the application a reality; “who” will use the application, and “how” do we measure our success.

Business Motivation Modeling

There are three business architecture models that address the Motivation aspect of the Business Owner’s perspective of an enterprise.  These models are high level views that do not depend on any particular technology.  In developing an enterprise performance management solution we will usually begin with one or more of the following business motivation models:

  • Business Goals Hierarchy (BGH)
  • Business Opportunities Hierarchy (BOH)
  • Business Problems Hierarchy (BPH)

These are business architecture models designed to show details of the business vision and strategy of an enterprise.  In practice the level-of-detail will vary with the scope of the engagement.  If we are engaged at the top executive level then the scope is enterprise-wide.  If we are engaged at the departmental or business unit level of an organization then the level-of-detail will need to be aligned with the scope of the sponsoring department or business unit in order to deliver value to the client.  The scope of the goals, opportunities or problems determines the scope of the strategy.  There are no well defined, hard and fast criteria for differentiating one level-of-detail from another.  The levels are there as guidance to help us think more architecturally about the aspects of the business of an enterprise.

Each model depicts, in a hierarchical fashion, a different type of motivator.  Each of the business motivation models is composed of a hierarchical set of “is a kind of” relationships. One approach is to start at the top with what is sometimes referred to as the apex motivator of the organization.  For example, what is the organization’s single most important goal.  This is most often a financial goal, but with the emerging interest in sustainability and the “triple bottom-line” may now incorporate environmental and social objectives as well.

In each model, the types of motivators depicted become more specific, finer grained, and less abstract as one progresses down the hierarchy, until reaching the “leaf node” of each branch.  Another approach is to start as close to the leaf level as possible and to progress up, across and down the hierarchy all at more or less the same time.  Many business analysts advocate, for reasons we need not discuss here, that this is the only practical way to actually make progress in a constrained time frame.  In either case a hierarchy of motivators is created.

The apex business goal is the highest level, most abstract and most all-encompassing of all the business goals in the subject area of the BGH (Business Goals Hierarchy).  The apex business opportunity is the highest level business opportunity in the BOH (Business Opportunities Hierarchy) and similarly with the Business Problems Hierarchy (BPH).

Though the three models, BGH, BOH and BPH, have virtually identical structures, goals tend to be more strategic in nature, while opportunities and problems, which are more immediate in nature, tend to be more tactical or operational.  In this article we will use the Business Goals Hierarchy to illustrate the concepts behind the data architecture of business plans.

Core Business Plan Elements

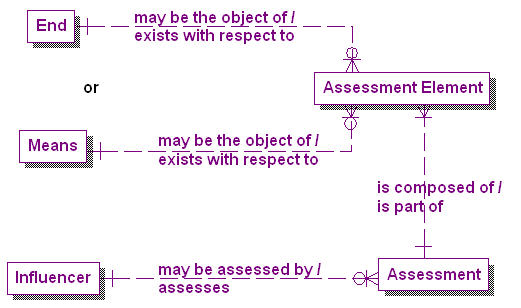
Figure 1 presents the core elements of the meta-model for business plans.  Business motivation is fundamentally about four things: Ends, Means, Influencers, and Assessments.  Anecdotally, Ends are where we want to get, Means are how we get there, Influencers are people, processes and technology that can influence getting there, and Assessments are how we measure if we got there.

Figure 1. Core elements of the Business Plans meta-model.

1.1-01 Core Elements Model

Correspondingly, in our meta-model, an End is something that an enterprise sets out to accomplish.  A Means is any capability that can be called on, activated, or enforced by the enterprise to achieve an End [v].  An Influencer is anything that can produce an effect on the enterprise without apparent exertion of tangible force or direct exercise of command[vi].  The effect of Influencers on Means and Ends is determined by one or more Assessments.  An Assessment is a judgment about the implications of the Influencer either with respect to one or more Means or with respect to one or more Ends.  Since an Assessment can have multiple implications, each Assessment must be composed of one or more Assessment Elements. Each of these Assessment Elements then must exist with respect to either one Means or one End [vii].

In other words, the metadata describing the data architecture of business plans also describes a re-useable template for building data models to analyze, compare and improve those plans.  Architecturally business plans must include data elements that represent the answers to the basic interrogatives that the plans are created to address.  These basic interrogatives will include: “What is the objective that is intended to be accomplished?” – the End; “How does the process work that will get the end accomplished?” – the Means; “Who are the people and organizations that influence the process?” and “What are the technologies and other processes that will get it accomplished?” – the Influencers; and, “When was or will it be accomplished, and “How closely to expectations did it turn out to be?” – the Assessments.  These are the meta-dimensions[viii] of the problem space.

Data elements that support the “When” interrogative, though not explicit in Figure 1, are very important as well, because we can accomplish our Ends through our planned Means, taking advantage of the appropriate Influencers and still fail our Assessment because the goals were not accomplished on a timely basis.

Ends

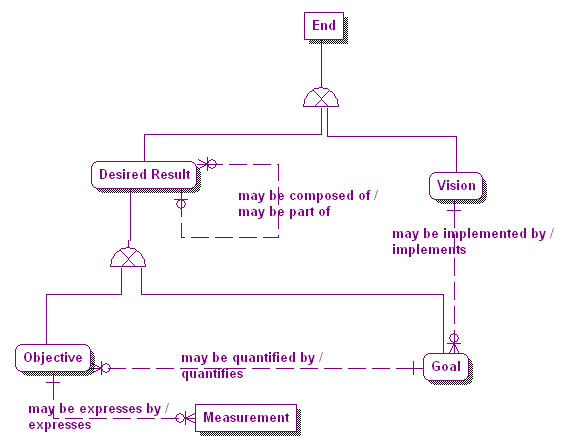
Figure 2 expands the business plans meta-model into two types of End: the Vision, which is the primary End that the enterprise sets out to accomplish, and the Desired Result, which is a state or target the enterprise intends to maintain[ix].

There are two types of Desired Result: Goals and Objectives. A Goal is a Desired Result that is a specific statement about a state or condition of the enterprise to be brought about or sustained through appropriate Means[x].  A Goal is an implementer of a Vision.  That is, where a Vision describes a future state of the enterprise in general, Goals define the steps to be taken to accomplish that Vision.  A Goal, by definition, is more narrow than a Vision.  A Vision is a broader or grander end state and cannot be specifically measured by Objectives, as a Goal can.

Figure 2. The Ends subject area in the Business Plans meta-model.

1.1-02 Ends Types Model

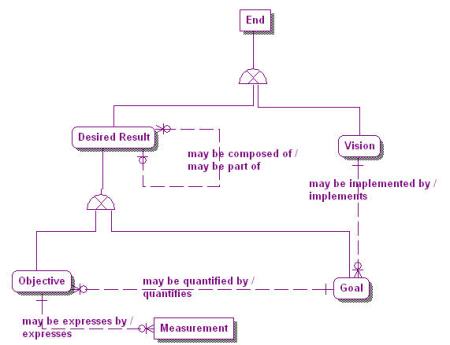
An Objective, on the other hand, is a statement of an attainable time-targeted and measurable Desired Result that the enterprise seeks to meet in order to directly achieve its Goals and through these, its Vision[xi].  An Objective, since it is measureable, quantifies a Goal. A Goal can be quantified by one or more Objectives, but an Objective can measure one and only one Goal.  A Measurement is a specific value expressing one state of an Objective.  An Objective can be expressed, usually serially over time, by one or more Measurements, but a Measurement expresses one and only one Objective.

Note from Figure 2 that a Desired Result can be composed of other Desired Results, thus creating a hierarchical structure.  Since Goals and Objectives are types of Desired Result, they too can have a hierarchical structure[xii].  This is the basis for the hierarchical structure of business goals in the Business Goals Hierarchy where higher level goal instances are composed of successively lower level goal instances until we reach the leaf level of atomic goals.  It should be noted that Measurements can be associated with any level of Objective and through this to any level in the hierarchy.

Business Goals Hierarchy

The Business Goals Hierarchy in Figure 3 describes Goals which the enterprise must achieve in order to accomplish its Vision.  In the BGH, Goals and Measurements are shown in the same model.  Typically Goals are depicted as orange “corner clipped” rectangles, and Measurements are depicted in the same model as yellow “corner clipped” rectangles[xiii].

Figure 3. A Business Goals Hierarchy (BGH).

BGH example

The fact that a Measurement measures one and only one Goal is an important quality control factor and provides a clear assessment vehicle for performance indicators, as we will see.  If a single Measurement is allowed to express more than one Objective and thus more than one Goal, there is no way to unambiguously trace a performance indicator using that Measurement back to the Vision of the enterprise and thus determine if it is a “key” performance indicator or not.

Of the three business motivation models (BGH, BOH and BPH) it is often advisable to start with the BGH first.  Identifying a set of business goals as the first deliverable of a workshop establishes the scope early in the process and helps assure that the client receives value for their investment from the start by identifying the Ends that the client wishes to accomplish.  It is the purpose of the BGH to capture and organize the Goals that will implement these Ends.  However it is critically important that the goals be attainable, that measurable Objectives be set for them, and that they are vetted by the organization.  There is sometimes the temptation to get the BGH over with quickly and get on with more tangible elements, but this would be a mistake.  The BGH helps us to stay on track and solve the right problems for the enterprise.  As other artifacts are developed it is always useful to go back to the BGH and ask yourself  “Does what I am doing now help to accomplish the business goals?”

Starting with the BGH can mean either discovering the business goals, through interviews, documents, or other information gathering methods, separately or in combination.  Or it could mean recording Goals that the enterprise has already identified and organizing them hierarchically.

One challenge in this process is getting participants to think “hierarchically” about business goals.  Quite often business goals are not tied together in people’s minds nor in documentation in such a way that they easily roll up to higher level business goals or roll down to lower level business goals.  Also, quite often business goals and objectives are not differentiated.  In order to facilitate an architectural approach to business we need to often disambiguate terms that are used interchangeably.  Business goals and objectives are examples of terms that need to be disambiguated in order to produce clear and executable business plans.

Means

There are three types of Means depicted in Figure 4, another portion of the business plans meta-model.  There is the Mission which is the primary Means by which the enterprise plans to make its Vision operative; the Course of Action which is an approach or plan for configuring some aspect of the enterprise; and the Directive which is a specification that governs or constrains a Course of Action[xiv].

Figure 4. The Means subject area in the Business Plans meta-model.

1.1-04 Means Types Model

A Course of Action must be either a Strategy or a Tactic[xv].  A Strategy is the essential Course of Action attempted to carry out an enterprise’s Mission.  The enterprise Mission, being the ultimate Means, can sometimes, though rarely, be carried out by more than one Strategy, especially for enterprises as vast as national governments or international corporations.  For that same reason it is impossible for a Strategy to carry out more than one Mission[xvi].  A Tactic is a Course of Action that implements a Strategy by representing one or more details of that Strategy[xvii].  A Strategy can be implemented by one or more Tactics, but a Tactic is the implementer of one and only one Strategy.

A Course of Action can be composed of one or more other Courses of Action.  However this compositional parent-child relationship does not cross Course of Action types.  In other words, one Strategy may be a part of another Strategy, and one Tactic may be a part of another Tactic.  But Tactics are separate element types from Strategies, they are implementers of Strategy, not parts of a Strategy.

The third type of Means, the Directive must be either a Business Policy or a Business Rule.  A Business Policy is a non-actionable Directive that guides the activities of the enterprise or governs them in a general way.  It “governs”, it does not control or shape Courses of Action[xviii].  A Business Rule is a more specific and actionable constraint on the enterprise.  In particular, based on a Business Policy, it imposes a constraint on a fact or fact type[xix]. A complete look at business policies and rules includes elements that describe enforcement levels, implementations of the enforcement levels, invocations of the consequences that are the result of the enforcement level implementations, and how enforcement levels and consequences are affected by tactics.  All of which are outside the scope of this article.

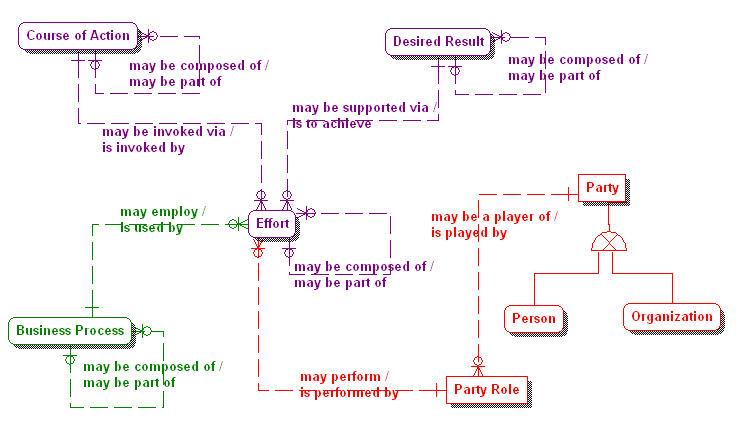
A Course of Action can also enable one or more other Courses of Action.  Enabling is not the same as implementing.  For example, a tactical Course of Action of an enterprise might be “Provide unified communication capabilities (i.e. integrated voice, email, instant messaging and video conferencing) to all employees”.  This Tactic may enable the Tactic “Reduce intra-company communication delays”, which may in turn enable the Strategy “Improve company responsiveness”.  Figure 5 shows the meta-model of this relationship.  In it, the element Enablement implements a composite relationship between two Courses of Action.  One Course of Action is the enabler of the relationship, while the other Course of Action is enabled by the relationship.

Figure 5. Enablement of Courses of Action.

1.1-05 Enablement Model

Strategies and Goals

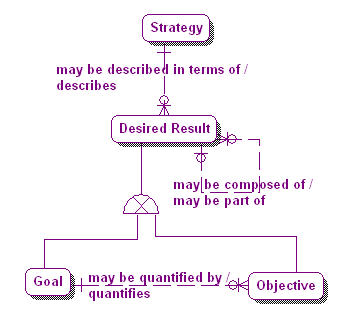
The link between an enterprise’s Ends and Means is characterized as the relationship between its Vision and Mission.  A Vision may be made operative by one or more Missions, and a Mission makes operative one and only one Vision[xx].   However most business planning activity takes place at the strategic level rather than at the mission level.   In making strategic decisions, an enterprise’s mission is often considered a constant set of values that the strategy must carry out.  With this in mind it makes sense to model the relationship between a Strategy, which is a type of Course of Action, and the Desired Results that describe it. Figure 6 illustrates this relationship. In it a Strategy may be described in terms of one or more Desired Results, each of which is either a Goal or an Objective.

Figure 6. Strategies and Desired Results.

1.1-06 Strategy & Desired Results

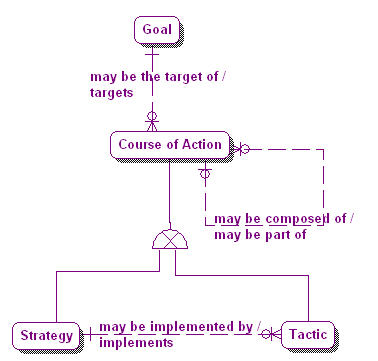
On the other hand a Goal, which is a type of Desired Result, may be the target of one or more Courses of Action, each of which is either a Strategy or a Tactic.  This relationship is illustrated in Figure 7.

Figure 7. Goals and Courses of Action.

1.1-07 Goal & Courses Actions

The basic takeaway here is that Courses of Action can be traced directly back to the Desired Results that motivate them.

Influencers and Assessments

To fully understand the meta-model of the data architecture of business plans it is necessary to understand not just its Ends and Means, but also with the real world things that influence them.  These we call Influencers, where an Influencer is anything that can produce an effect on the enterprise without apparent exertion of tangible force or direct exercise of command[xxi].

The effect of Influencers on Ends and Means is determined by one or more Assessments, where an Assessment is a judgment about the implications of the Influencer either with respect to one or more Means (such as a particular Course of Action) or with respect to one or more Ends (such as a particular Desired Result)[xxii].

Figure 8 shows that portion of the meta-model that represents Influencers and Assessments.  We can see that an Influencer is an example of one and only one Influencer Type.  These types can be as basic as “Internal Influencer” and “External Influencer”, which tell us very little about this element, or all the way to a full taxonomy of Influencer Types, which can include all aspects of an enterprise.  Influencer Types can also be nested in a supertype-subtype generalization hierarchy.  A full analysis of influencers is well beyond the scope of this article.  We also see that while an Assessment assesses one and only one Influencer, each Assessment must be composed of one or more Assessment Elements.  Each Assessment Element, as was observed earlier, in Figure 1, must exist with respect to either one Means or one End.  

Figure 8. Influencers and Assessments.

1.1-08 Influencers Assessments

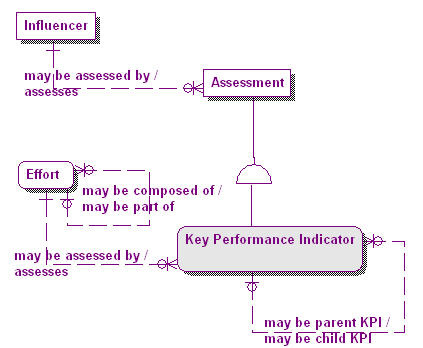
It is the Assessment Element and the fact that it may be revealed by one or more Potential Impacts on the enterprise that is the basis for the Key Performance Indicator (KPI).  Figure 9 introduces the KPI into the meta-model as a type of Assessment.  Because a KPI can be composed of other KPIs it has a reflexive parent-child relationship with itself.  Each Assessment has its own types of Assessment Elements.  Frequently encountered Assessment Elements include those used in “SWOT” analysis, such as Strengths, Weaknesses, Opportunities and Threats.

Every KPI must have at least three Assessment Elements.  Target Expression, Actual Expression, and Status Expression are each a mandatory part of a KPI.  In addition it can have other Assessment Elements which are optional.  We will discuss these and other aspects of the data architecture and meta-model of KPIs in the second part of this article.

Figure 9. Assessments and KPIs.

1.1-09 Assessments & KPIs

Conclusion

The data architecture of business plans, also known as the Business Motivation Model, is important because it can be used to trace the results produced by Assessment Elements like Key Performance Indicators back all the way to the core motivational elements of an enterprise, its Ends and its Means.  If the chain of traceable associations from Assessments like KPIs is unbroken, it is possible to architecturally trace back to the Desired Results that motivate an enterprise’s Courses of Action to understand the rationale for the Measurements used in the Assessment Elements of Key Performance Indicators that provide the most relevant picture of an enterprise’s performance.  A refrain often heard in EPM projects is “Are we measuring the things that really matter?”  “What are the things that will make the most difference to the enterprise?” With this two part article we will show that you can verify and validate these important associations through traceability all the way to the enterprise’s Ends and Means.  In the second part of the article we will discuss how KPIs, Scorecards and Dashboards tie these elements together.


[i] I am referring to the co-ordinates of the Zachman Framework for Enterprise Architecture, first discussed in 1987, and extended in “Extending and Formalizing the Framework for Information Systems Architecture”, J.F. Sowa and J. A. Zachman, IBM Systems Journal, vol. 31, no. 3, 1992. IBM Publication G321-5488.   For more on the Zachman Framework please refer to the website http://www.zifa.com/ .

[ii] Concepts in this article are based on the publications: “The Business Motivation Model, Business Governance in a Volatile World”, The Business Rules Group, Copyright 2007, The Business Rules Group, For more information refer to http://www.BusinessRulesGroup.org.  This publication has since been replaced by the “Business Motivation Model, Version 1.0” published in August 2008 by the Object Management Group (OMG). For more refer to http://www.omg.org/ .

[iii] The view that there are three types of performance dashboards comes primarily from: Performance Dashboards: Measuring, Monitoring, and Managing Your Business, Wayne Eckerson, John Wiley and Son, October 2005. For more information see http://www.wiley.com/WileyCDA/WileyTitle/productCd-0471757659.html.

[iv] “Six Basic Interrogatives – Parts 1, 2 and 3, http://www.datawarehouse.com/article/?articleId=5140 .

[v] Data Model Patterns: A Metadata Map, David C. Hay, The Morgan Kaufmann Series in Data Management Systems, Morgan Kaufmann, 2006.  Page 277.

[vi] Hay, Page 284.

[vii] Hay, Page 287.

[viii] Please forgive me for introducing yet another term into our ever growing business and IT vocabularies, but the metamodel of a dimensional database design would contain “meta-dimensions”, would it not?

[ix] Hay, Page 277.

[x] Hay, Page 277.

[xi] Hay, Page 277.

[xii] In object oriented terminology we would say that “Goal” is a sub-type of “Desired Result” and inherits its properties, including its relationships.  In this case the relationship is an aggregation, or “part of “ relationship, with itself, creating a reflexive relationship.

[xiii] The color and symbol are arbitrary of course, but standard representations enhance readability and give the same type of artifact consistency across projects giving a type of “human resource” re-usability. After all if a consistent symbol is always used to represent the same type of thing less re-learning, is required. This also a principle of good data display, always use the same color to represent the same thing.

[xiv] Hay, Page 278.

[xv] Hay, Page 278.

[xvi] As a comment I would add  that it is often when an enterprise attempts to use a strategy to accomplish more than one mission that it loses sight of the original mission of the strategy and adds unnecessary and dangerous ambiguity to that mission.

[xvii] Hay, Page 278.

[xviii] Hay, Page 280.

[xix] Hay, Page 280.

[xx] Hay, Page 276.

[xxi] Hay, Page 284.

[xxii] Hay, Page 285.

A Simplified Enterprise Architecture Framework

September 4, 2013

An Enterprise Architecture Framework is an approach to aligning the multi-million (or billion) dollar investments that all large organizations (public and private) have made, and are still making in information technology, with the mission of the organization. An organization’s mission begins with its vision. A vision is described by David Hay, as a desired future state of the enterprise without regard to how it is to be achieved.[i]  Its vision is the synthesis of the ends that an enterprise sets out to accomplish and its mission is the means by which it plans to accomplish this vision. This can only be done successfully with an approach that emphasizes collaboration, planning, monitoring, analysis and action.

Business plans include all the ends the enterprise sets out to accomplish and all the means by which it plans to accomplish them. These include such objectives as goals to be met, opportunities to pursue, problems to solve, constituencies to service, expectations to satisfy, and how to increase the value of the company’s equity. Often these objectives are not initially stated in a way that can be measured. It is the mission of Enterprise Architecture to organize, structure and ultimately measure these objectives.

It is when the objectives of the mission are set in the environment in which an organization operates, including such factors as business locations, technologies deployed, functions performed, competitor and partner analyses, competencies, industry trends, and institutional knowledge that we begin to see the need for organizing, structuring and measuring the factors that influence the strategy of the enterprise in pursuing its mission.

But the most carefully crafted strategy is no more than words without the business processes and functional organization structure to carry it out. The more abstract aspects of the strategy need to be made actionable through less abstract processes and patterns of behavior that can actually be performed, and measured. To this end then competitors, partners, providers, regulators, customers, human resources and even the enterprise itself become the parties that are of interest to the enterprise. Do these factors make sense in the context of the mission? These are the factors that perform, constraint and regulate the carrying out of the mission. In short parties become the “Who” aspect of the enterprise.

In addition to the parties whose behavior influences the pursuit of the mission, all enterprises produce something they hope to be able to exchange for value with other parties. This, of course, is the enterprise’s product. In general an enterprise’s product takes the form of either goods, services, or some combination of the two to form more complex compound products. While most of the parties with whom an enterprise engages are outside of the direct control of the enterprise, the definition and pricing of products is typically under tight enterprise control.[ii] This is so as long as there is a clear value proposition for the product. In this modern post-virtual world an enterprise’s challenge is often to clearly define just what its products are and what its unique value proposition is. In many ways the product is the enterprise. Products become the “What” aspect of the enterprise.

Parties and products are not just naturally associated with one another. There has to occur some activity between the parties with the ultimate intent of producing, assessing or exchanging products between them. Each party must perceive there to be more value to themselves in the product they receive than the value of the product they give up in the production, assessment or exchange. Almost always one of the products given in an exchange is money, in the form of price or compensation.

These exchanges are the life blood of any enterprise. It is how the enterprise accumulates capital to enable it to grow, it is typically how “success” is measured, and at the most fundamental level it is how the enterprise pays its bills and remains intact and the master of its own destiny. Exchanges, then become the “How” aspect of the enterprise. These exchanges and the processes that implement them are how an enterprise accomplishes its mission.

With the virtualization and digitalization of so many traditional channels it is tempting to think that “location no longer matters”. I feel this would be a mistake however. Most of the parties an enterprise deals with, especially customers, still live in the “real world” or at least their virtualization can be resolved to real physical human beings and organizations of human beings who typically need or use a real address somewhere on earth. This is especially true of the customers you hope to reach (or constituencies you hope to serve), even if the address you associate with them is itself virtual like a “Facebook” or professional community or an e-commerce website. And, of course, the enterprise itself is located somewhere. These locations, and the addresses that represent them become the “Where” aspect of the enterprise.

We have all heard the cliché that “time is money” or the old dictum “tempus fugit”. For better or worse we live in a world delimited by time. Time usually takes two forms, moments in time, that is “events”, and durations, how long something takes. This time bounding defines the “When” aspect of the enterprise. Since another cliché, “time is money” almost always proves to be true, the time aspect of an enterprise can have a profound effect of its ability to sustainably accomplish its mission.

The final aspect of the enterprise concerns motivation and is quite often the most difficult to measure and to recognize its effect on the performance of an enterprise. The motivation aspect addresses the question of why certain courses of action are chosen or should be chosen, why certain types of persons and organizations are important, why certain products should be more heavily invested in and what corrective actions need to be taken for others, why certain events are important, and why some locations are preferred over others. Motivational factors are typically measured by inference, based on our assumption that because certain motivators were in place when an action took place that the motivators influenced that action. To an extent accepting the effect of this influence is an issue of convention. Never the less, no one can argue against the real changes in behavior brought about by strategically placed incentives, both positive and negative. Nor can we overlook the motivation of measurement itself, as has been said “what gets measured gets done”, which makes it imperative to measure the right things.[iii] Motivators become the “Why” aspect of an enterprise, and they can vary from the altruistic to the purely financial.

Enterprise Architecture has become a lot more visible and has received a lot of coverage in the IT press over the past five to ten years. This is at least in part due to the U.S. government’s passage of the Clinger Cohen Act back in 1996, and also to a growing need for organizations in both the public and private sectors to link together two of the most predominant initiatives within their operations: the strategic direction of the business and the increasing investment in information technology. The idea is to align the technology investment with the strategic direction. While there are many different approaches to doing this they almost all fall under the heading of Enterprise Architecture in one way or another. This gradual recognition of Enterprise Architecture has led to an increase in methods to implement it. Some of these ideas go way back to the 1980’s and others are purely 21st century phenomena.

Many of the approaches to Enterprise Architecture require tremendous dedication and effort to understand and implement. What I have attempted to show in this brief article is that there is an approach that builds on what many people already know . It essentially ties together the strategy and business processes of the Business Architecture with the computer based applications and infrastructure of the Technical Architecture. This linkage, especially where business process objectives are directly and logically realized in computer applications forms the traceability needed to verify the entire end-to-end Enterprise Architecture, from the top of the value chain in vision and mission through to the most physical aspects of the value chain in the components of the software and hardware infrastructure required to automate its implementation.


[i] Data Model Patterns, A Metadata Map, David Hay, 2006.

[ii] With knowledge work continuing to become more and more critical to successful value creation for both individuals and organizations it seems fair to assume that the era of the “loyal” employee will continue to recede further into the past.

[iii] A topic for another article, and my apologies to the former CEO of GE often credited for this quote.